HMGA Water Project
  • Home
  • Project Overview
    • Project Description
    • Project Team
    • Collaborative Projects
    • FAQ
  • Publications
    • Blog
    • Factsheets
    • News Articles
  • Events
  • Gallery
  • Dedirting
  • Contact

Lesson Learned: Technology Selection

7/11/2016

1 Comment

 
​Problem: A greenhouse facility wants to reuse water from a flood floor which is used to water potted plants. The water collected has vermiculite and organic matter clouding the water which would clog nozzles and settle in pipes.
 
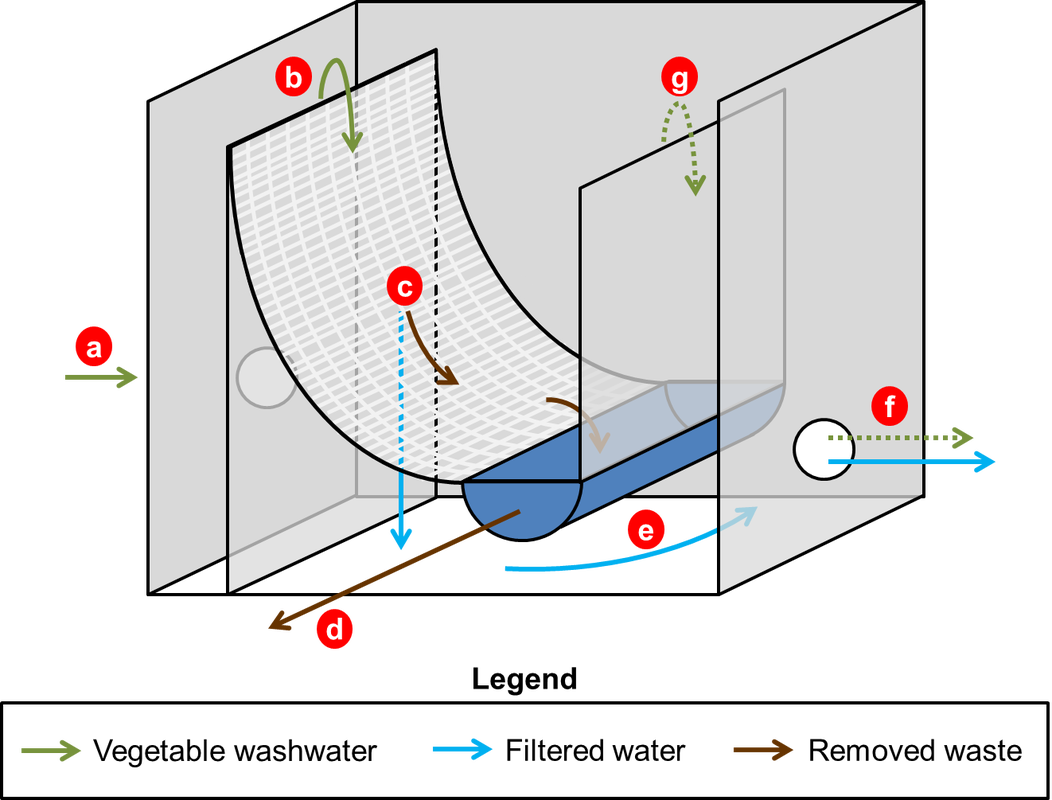
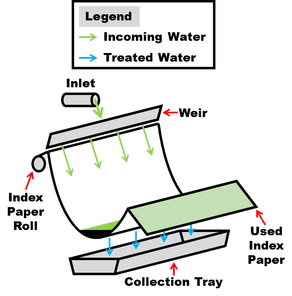
Solution: The operator looked at two different technologies, a self-indexing filter and a parabolic filter screen (Figures 1 & 2). Both are recommended units that filter coarse material from water.
Picture
Figure 1: Diagram of a self-indexing filter [level sensor is tripped when water rises due to clogged paper and roll is unspooled]
Picture
Figure 2: Diagram of a parabolic filter screen [(a) inflow; (b) flows onto screen; (c) waste remains on screen and treated water falls through; (d) waste exits through tray; (e) treated water exits through (f); (g) water overflows if screen becomes clogged and exits through (f)]
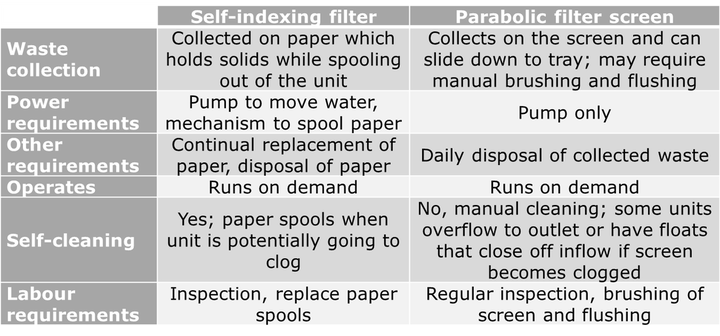
​Discussion: The infrastructure required for either technology is similar; both will need some plumbing and a pump to move water through the treatment system. The technologies are compared in the table below. Both systems will complete the task; the self-indexing filter is more hands-off but requires more inputs. The parabolic filter screen must be supervised but has minimal on-going costs.
Picture
​Decision: The operator choses the self-indexing filter as it requires less regular supervision. The additional energy costs, on-going need of paper rolls, and disposal of paper was preferable to increased labour requirements and disposal of waste.
 
Lesson Learned: When there are multiple technologies that could fit in a treatment system it is important to investigate all aspects. Decisions should be made based on more factors than merely cost.
1 Comment

Mass Loading Calculations

7/6/2016

0 Comments

 
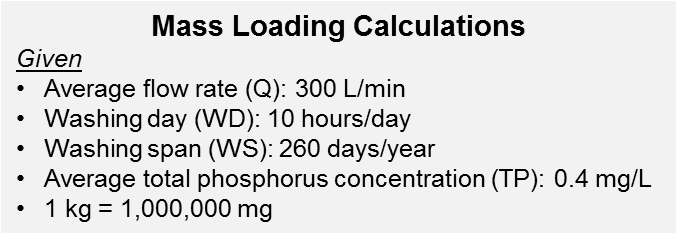
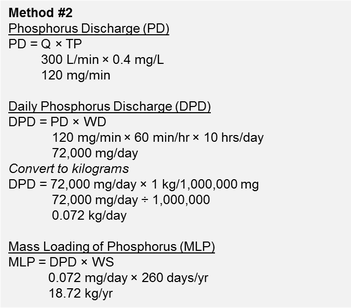
The mass loading of a discharge is a useful tool in selecting and sizing treatment equipment. The calculation is completed by comparing the daily flow rates with values obtained from water quality sampling and analysis.

Often times, concentrations of parameters from water quality sampling provide results in mg/L. The flow measurements are recorded in L/min; the official designation for flow in calculations is ‘Q’. With the addition of the time period of the water, all the variables to calculate mass loading are present.

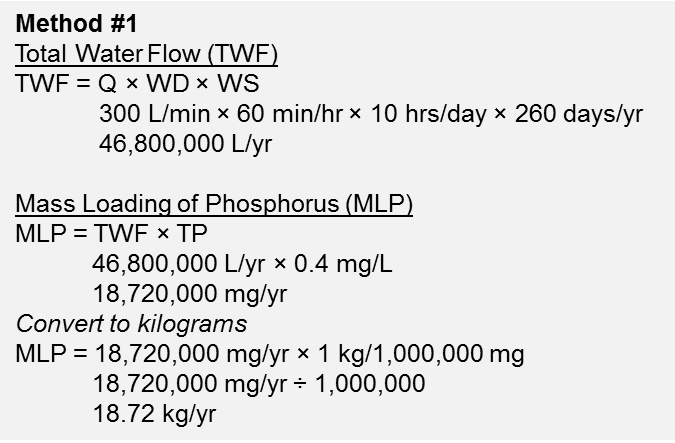
There are multiple methods to reach the final number; two of the possible ways are presented to the right.

​Calculating the mass loading of a water stream is vital stage of water characterization. It will be important when creating a treatment system, deciding how to handle the waste stream, and discharging or re-purposing the final water.

More information on measuring flows is available in 'Monitoring Discharge Flows'. Instructions on sampling procedures can be found in Factsheet #006 Water Sampling & Proper Procedures.
Picture
Picture
Picture
0 Comments

Settling Soil

7/5/2016

1 Comment

 
Read about how to complete a jar test in ‘The Trouble with Muck: Size’.
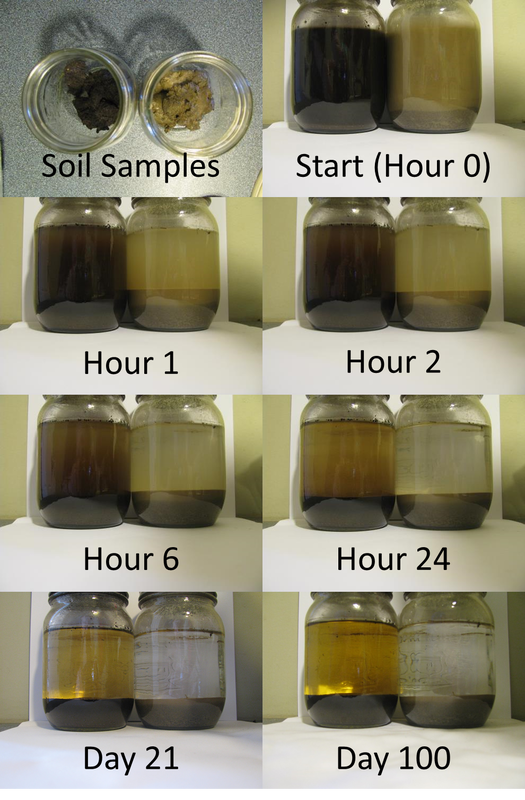
Throughout the project there have been discussions about the different lengths of time it takes to settle different soil types. In general sand settles the quickest followed by silt, clay, and lastly, muck. To demonstrate this process, jar tests were done with a mineral and muck soil sample. Jar tests are simply soil added to water and left to settle. The depth of the water to the top of the sediment layer was measured as 2 1/8”.

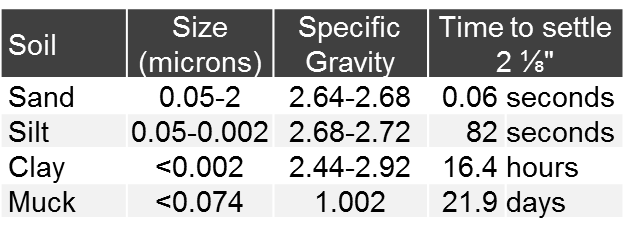
​The test was evaluated by taking pictures of the two jars at regular intervals (Figure 1). Calculations were done to predict when the various soils would settle out of the water, shown in Figure 2. As expected, the order in which they settled was sand first, then silt, clay, and finally muck. The sand settled so quickly it was impossible to get a picture with it still in suspension. The silt followed soon after and then took a period of time to fill in the spaces between the sand particles. Clay can be seen in suspension in Hour 6 but has cleared in Hour 24.


The calculations predicted that the muck would have settled in 22 days. While most of it cleared by the 21st day, the picture taken on the 100th day shows that there are still particles in suspension.

​Lastly, in both jars there is a layer of organic matter floating on the surface. These particles have made no downward movement through the time period.


The jars will continue to be monitored to determine whether the colour clears from the jar containing the muck soil.
Picture
Figure 1: The soil samples placed in Mason jars for the soil settling test and results over 100 days
Picture
Figure 2: Size and specific gravity of sand, silt, clay, and muck, and the average time to settle 2 1/8"
1 Comment

Monitoring Discharge Flows

7/4/2016

0 Comments

 
For a general description of the process see 'Flow Monitoring'.

Introduction
Flow meters were utilized throughout the HMGA Water Project in order to determine water flows generated by processing carrots and other root vegetables. These values are used to properly size treatment equipment.
Components
The flow meters used included the Hach FL900AV meter with Hach Flow-Tote 3 AV sensor. The two components communicate with one another via a cable to measure and record. The Hach flow meters were chosen due to their reliability, ease of use, and their ability to determine flow in a variety of conditions. Often the water being discharged from the facility would have high solids content which would likely cause improper readings if other types of sensors had been used (mechanical sensors would likely get clogged/jammed for example). This flow sensor has three electrodes pointing out of the sensor base which are designed in such a way as to prevent the build-up of debris on the sensor. Pipe bands are used to secure the Flo-Tote 3 sensor inside an outlet pipe; they ranged in size from 8” to 14”, but other sizes are available.
Picture
(Top left) Hach FL900AV meter and Hach Flow-Tote 3 AV sensor; (Top Right) Hach Flow-Tote 3 AV sensor with three protruding electrodes; (Bottom left) Sensor installed on pipe band; (Bottom right) Band and sensor placed in the discharge pipe.
The Hach Flo-Tote 3, installed in a pipe, acts as the sensor which measures velocity and level of water. The sensor sends velocity and depth measurements through the cable to the Hach FL900AV meter which calculates flow and acts as a data logger. The data is stored for several days until it is downloaded to a computer. The Hach FL900AV meter is powered by four 6V lantern batteries. The unit is based on the principals of Faraday’s Law of electromagnetic induction. As the water moves through a magnetic field created by the sensor, it produces a voltage which is then recorded. The faster the water, the higher the voltage produced. Using the voltage, a velocity is determined. Flow is calculated by multiplying the velocity by the area of the pipe (Q=AV). The level of water in the pipe is measured using a pressure transducer. The transducer is made up of a thin diaphragm which converts exerted pressure to an electronic signal.

​The software used to compile data, FSData Desktop Instrument Manager, allows the user to graph flow, velocity, and water level. An exporting function is also available to convert data to a .csv file which is compatible with Microsoft Excel.  FSData is also used to calibrate the instrument at installation.
 
Limitations
The flow sensors could not be placed in pipes with a diameter less than 8” due to the width of the sensor, water would flow beneath the flow sensor due to the curve of the pipe. It can operate between -18°C to 60°C. The accuracy of the Flo-Tote 3 sensor was ±2% of reading.
 
Installation and Use
An appropriate band is chosen based on the pipe diameter. The Flo-Tote 3 sensor is attached to the band using screws and the cable from the sensor is affixed to the back of the band using zip-ties with ends snipped in order to have minimal effect on the flow. The sensor and band are then placed into the outlet pipe as far in as possible to minimize turbulence and create a streamlined flow. Lastly the sensor is connected to the logger.

The logger is then connected to the computer using FSData Desktop Instrument Manager. The Set-Up Wizard found within FSData requires the pipe diameter and current water level measurements be manually measured and inserted into the program. This is required once at initial start-up.

​Logging measurements can be set at variable time intervals to suit the application; for example, readings can be taken every 60 seconds. In such cases, there is a need for greater program memory to capture data over longer periods of times. The data is collected by connecting the Hach FL900AV meter to a laptop computer via a cable.

Taking flow measurements in regular intervals provides a clear description of a set period of flow. Peak flows will be displayed as well as regular flow conditions.

Reference
  • Hach Company (2013). Flo-Tote 3 sensor: Open channel flow sensor – User manual. Retrieved from http://www.hachflow.com/pdf/Flo-Tote3Man.pdf on 22 June, 2016.
0 Comments

    Project Updates

    Find articles on project-related topics here

    Archives

    December 2016
    October 2016
    September 2016
    July 2016
    June 2016
    May 2016
    April 2016
    March 2016
    February 2016
    January 2016
    December 2015
    November 2015
    October 2015
    September 2015
    August 2015
    July 2015
    June 2015
    May 2015
    April 2015
    March 2015
    February 2015
    January 2015
    December 2014
    November 2014
    October 2014
    September 2014

    Topics

    All
    Aerators
    Coagulation & Flocculation
    Deionization
    Discharge Characterization
    Drum Filter
    Filter Bags
    General Information
    Hydrocyclone
    Lake Simcoe
    Lesson Learned
    Muck
    Nottawasaga Valley
    Pre Treatment
    Pre-Treatment
    Sampling
    Settling Ponds/Tanks
    South-Eastern Georgian Bay
    System Evaluation
    Treatment Technologies
    Ultrafiltration
    Washing Process
    Water Quality Parameters
    Watershed

    RSS Feed

    Article Titles

    Introduction to
      Watersheds

    Lake Simcoe Watershed
    Nottawasaga Valley
      Watershed
    South-Eastern Georgian
      Bay Watershed
    Water, Water,
      Everywhere?
    The Trouble with Muck:
      Size
    Lesson Learned: Bottom-
      up Aerator to Treat
      Washwater in Settling
      Tanks
    Phosphorus, the
      Environment, and
      Farming
    Nitrogen’s Impact on Air,
      Land, and Water
    Water-borne Pathogens
      and Food Safety
    Defining Dissolved
      Oxygen
    Filter Bags
      Demonstration Site
    Organic Matter
      Breakdown &
      Biochemical Oxygen
      Demand
    Dealing with Cloudy
      Water
    Hydrocyclone
      Demonstration Test
    What IS Muck?
    Demystifying Oxidation-
      Reduction Potential
    News Release
      "Technology
      Investigation: Filter
      Bags"
    Drum Filter
      Demonstration Site
    Decomposing With(out)
      Oxygen
    Flow monitoring
    Lesson Learned: Drum
      Filter Optimization
    Polders & the Holland
      Marsh
    Vegetable Washing
      Process
    ​Dry Soil Removal
    Ultrafiltration &
      Deionization
      Demonstration Site
    News Release
      "Technology
      Investigation:
      Ultrafiltration &
      Capacitive Deionization"
    Progressive Passive
      Filtration
    ​Dissolved Air Flotation
    Clarifying the Solid
      Removal Process
    Factsheet Reading Order
    News Release:
      "Technology
      Investigation:
      Coagulation &
      Flocculation"
    Self-Indexing Filter
    Monitoring Discharge
    ​  Flows
    Settling Soil
    Mass Loading
      Calculations
    Lesson Learned:
      Technology Selection
    Electrocoagulation
    Auto-Samplers
Powered by Create your own unique website with customizable templates.