HMGA Water Project
  • Home
  • Project Overview
    • Project Description
    • Project Team
    • Collaborative Projects
    • FAQ
  • Publications
    • Blog
    • Factsheets
    • News Articles
  • Events
  • Gallery
  • Dedirting
  • Contact

Nitrogen’s Impact on Air, Land, and Water

12/1/2014

0 Comments

 
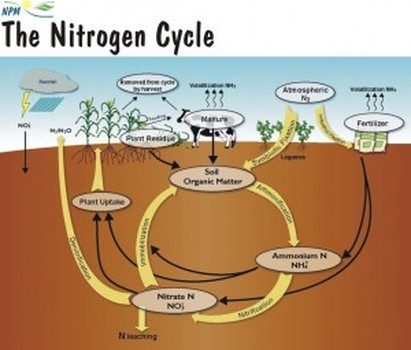
Nitrogen is an essential nutrient for the survival and growth of most living organisms.  Nitrogen gas is a large constituent of the atmosphere, making up approximately 80% of the air, but this form is inaccessible by most plants. Certain bacteria in soils have the ability to ‘fix’ naturally-occurring nitrogen from the atmosphere, which converts it to a usable form for the plants, it can also be fixed by lightning or through an industrial process which makes nitrogen fertilizers. Nitrogen is generally the limiting nutrient in terrestrial ecosystems, and is applied to fields through use of fertilizers and manure. Once in the soil, the nitrogen will be used by the crops, leached down, or emitted into the atmosphere. In the soil, ammonium (NH4+) or ammonia (NH3) is broken down by bacteria through nitrification in which it is converted first to nitrite and then to nitrate. 
Picture
Figure 1: The Nitrogen Cycle [Source: http://fyi.uwex.edu/discoveryfarms/2010/10/fall-can-be-a-good-time-for-nutrient-application-with-awareness-of-conditions/]
Both nitrites (NO2-) and nitrates (NO3-) are highly soluble forms of nitrogen and thus are transported easily in water and do not attach to the soil. Nitrite is more toxic than nitrate but since the processes changing nitrite to nitrate happen quickly it is not generally found in large quantities. Though less toxic, high concentrations of nitrate in aquatic systems can have both acute and chronic lethal effects on amphibians as well as any species which prey on amphibians, such as fish. NH3 which has not been converted through nitrification can also have harmful effects on aquatic organisms. The major sources of NH3 in aquatic systems are wastewater and treatment plants. 
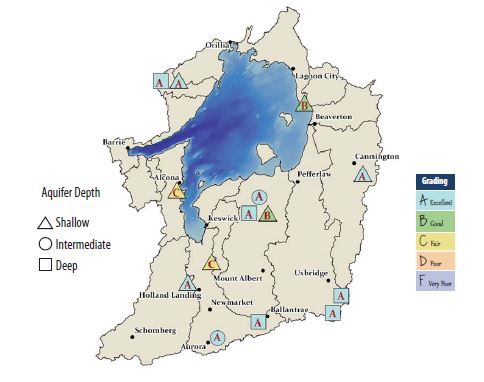
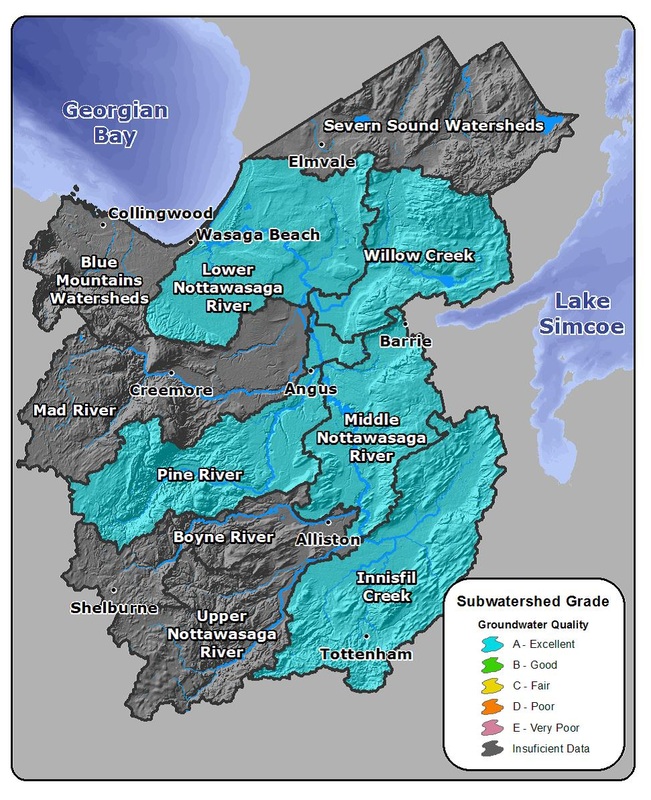
In both the Lake Simcoe Region (Figure 2) and Nottawasaga Valley (Figure 3) watersheds, the groundwater quality ranges from fair to excellent, with fair ratings due to chlorine amounts as opposed to NO2- + NO3- levels. This means that the Holland Marsh, an intensive agricultural area, contributes low amounts of NO2- + NO3-.
Picture
Figure 2: Groundwater Quality in the Lake Simcoe Watershed 2013 [Source: Lake Simcoe Region Conservation Authority, 2013]
Picture
Figure 3: Groundwater Quality in the Nottawasaga Valley Watershed 2013 [Source: Nottawasaga Valley Conservation Authority, 2013]
References
  • Lake Simcoe Region Conservation Authority. 2013. Lake Simcoe Watershed Report Card 2013. Newmarket, ON http://www.lsrca.on.ca/about/watershed_report_card.php
  • Nottawasaga Valley Conservation Authority. 2013. Nottawasaga Valley Watershed Report Card 2013. Utopia, ON http://www.nvca.on.ca/watershed-science/watershed-report-cards
  • Ontario Ministry of Agriculture and Rural Affairs. 2005. Factsheet - Environmental Impacts of Nitrogen Use in Agriculture. Order No. 05-073. Guelph, ON http://www.omafra.gov.on.ca/english/engineer/facts/05-073.htm#5
  • Rouse, J.D., Bishop, C.A., & J. Struger. 1999. Nitrogen Pollution: An Assessment of Its Threat to Amphibian Survival. Environ Health Perspect 107:799-803
  • Environment Canada. 2013. Ammonia Dissolved in Water. CAS (Chemical Abstract Service) registry number: 7664-41-7 https://www.ec.gc.ca/toxiques-toxics/Default.asp?lang=En&n=98E80CC6-0&xml=E9537B48-E09B-4FCF-8A56-F1F44B97FAE4
0 Comments

Water, Water, Everywhere?

10/28/2014

0 Comments

 
Canada is the second most water-rich of the OECD countries with 85,516 cubic metres of renewable freshwater per capita. However, 60% of this water is unavailable to 85% of the population as it flows north away from the city centres. With this in mind, Canada still ranks fourth. It is also the second highest water user at 1,441 cubic metres per capita. Even with high water usage, only 2% of the renewable freshwater resources are withdrawn from the source annually. Ninety-six percent of the water comes from surface sources such as lakes and rivers and the remaining 4% is taken from groundwater sources. From 1985 to 1995 the amount of water withdrawn from these sources annually dropped 0.4% and in 1996 it was estimated that 20% of the water went to domestic and household use, 69% to industrial and commercial uses, and 12% to irrigation and agriculture.

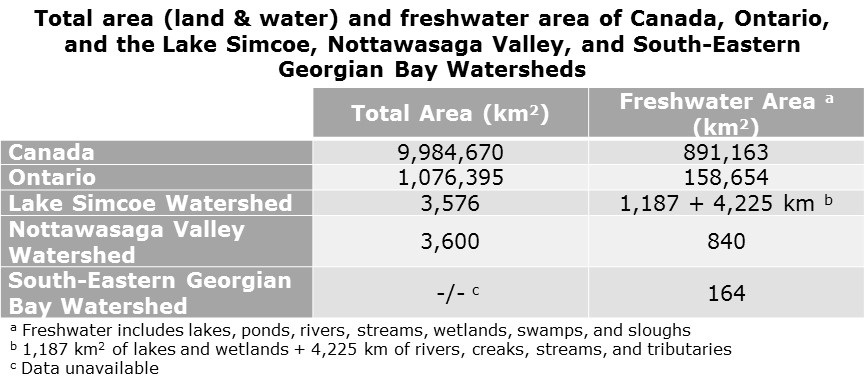
The breakdown of land and water surface area is shown below. Canada and Ontario have 8.9 and 14.7% respectively of their total area in freshwater, which is made up of lakes, ponds, rivers, streams, wetlands, swamps, and sloughs (CWF [1]). The Lake Simcoe and Nottawasaga Valley Watersheds have 33 (lake and wetlands only) and 23% respectively of their land area under water (EC).

Canada has a large supply of freshwater but is also one of the highest users of water. Even though overall the country has vast amounts, the distribution is uneven and access is limited in some areas. Challenges moving forward for the country, the province, and these watersheds include an increasing demand as the population grows and combating pollution while protecting the freshwater sources.

Unless otherwise noted, data is sourced from CWF [2]
Picture
[Data adapted from CWF [1] and EC]
References
  • Canada West Foundation & Vander Ploeg, C. G. [1] (2011, September). Canada’s Waterscape in Context. In Canadian Water Policy Backgrounders. Retrieved October 6, 2014, from http://cwf.ca/pdf-docs/publications/Water_Backgrounder_2_Sept_2011.pdf
  • Canada West Foundation & Vander Ploeg, C. G. [2] (2011, September). Water, Water Use and Water Pricing Around the World. In Canadian Water Policy Backgrounders. Retrieved October 6, 2014, from http://cwf.ca/pdf-docs/publications/Water_Backgrounder_2_Sept_2011.pdf
  • Environment Canada. (2014, September 5). Lake Simcoe/South-eastern Georgian Bay Clean-Up Fund (LSGBCUF). In Environment Canada - Water - Lake Simcoe Clean-Up Fund. Retrieved September 15, 2014, from http://www.ec.gc.ca/eau-water/default.asp?lang=En&n=85C54DAE-1
0 Comments

South-Eastern Georgian Bay Watershed

10/20/2014

0 Comments

 
Part 4 of a 4-part series on watersheds

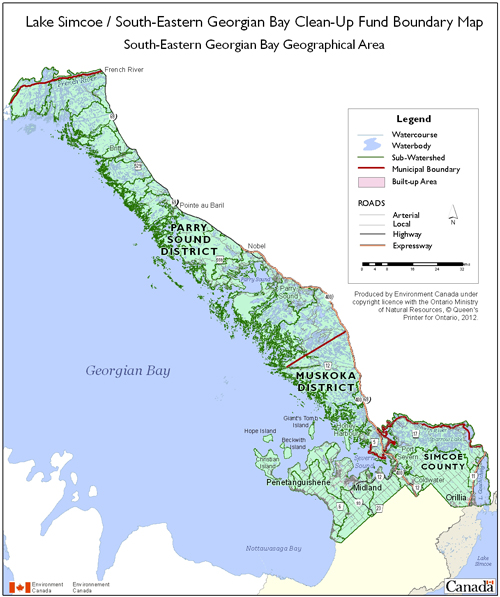
This watershed is divided into three parts, Lake Couchiching, Severn Sound, and Georgian Bay Coast. The first section is positioned at the southeastern tip of the area around the 34 square kilometre Lake Couchiching which is at the top of Lake Simcoe (EC). Severn Sound is comprised of a 130 square kilometre series of bays on south-eastern Georgian Bay (EC). The final part of this watershed is the section of coastline between Port Severn and where the French River enters Georgian Bay.

The townships of Severn, Tay, and Tiny, the Towns of Midland and Penetanguishene, and the City of Orillia in Simcoe County and areas along the coast in the Districts of Muskoka and Parry Sound are all represented in this watershed.

This watershed supports a large recreational and tourist industry. Severn Sound has a permanent population of 110,000 that swells seasonally to 300,000 (EC). The cottage industry is causing development along the coasts as it grows and this could become a concern as the integrity of the coastline is changed. Agriculture also has a presence; in Severn Sound there are about 900 farms on approximately 270 square kilometres (SSEA [1]).

Severn Sound was identified as an ‘Area of Concern’ by Environment Canada due to degraded water quality and environment health. Through phosphorus control, habitat restoration and enhancement, pollution prevention, planning, environment monitoring, and public education, it was removed from the list in 2003 (SSEA [2]).
Picture
South-Eastern Georgian Bay Watershed [Picture Source: EC]
References
  • Environment Canada. (2014, September 5). Lake Simcoe/South-eastern Georgian Bay Clean-Up Fund (LSGBCUF). In Environment Canada - Water - Lake Simcoe Clean-Up Fund. Retrieved September 15, 2014, from http://www.ec.gc.ca/eau-water/default.asp?lang=En&n=85C54DAE-1
  • Severn Sound Environmental Association. [1] (n.d.). Description of Severn Sound. In Severn Sound. Retrieved September 15, 2014, from http://www.severnsound.ca/SSEA_AU_SevSound.htm
  • Severn Sound Environmental Association. [2] (n.d.). Severn Sound Remedial Action Plan. In Severn Sound. Retrieved September 15, 2014, from http://www.severnsound.ca/SSEA_AU_SSRAP.htm
0 Comments

Nottawasaga Valley Watershed

10/14/2014

0 Comments

 
Part 3 of a 4-part series on watersheds

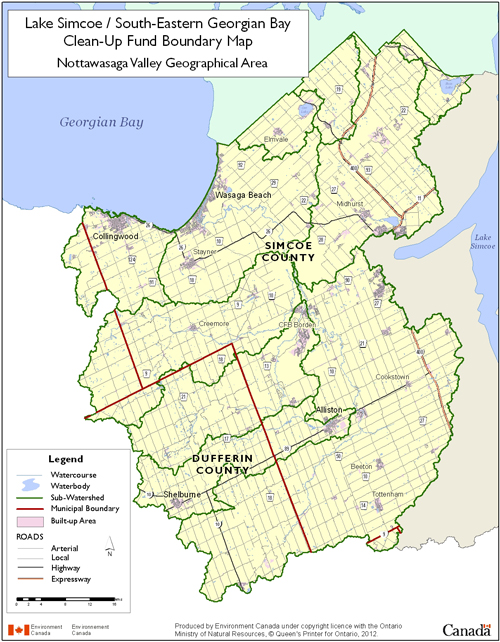
The Nottawasaga Valley Watershed is approximately 3,600 square kilometres of land and water (EC). The surface water can be broken down into three categories; there are 13 square kilometres of lakes, 585 square kilometres of stream systems, and 242 square kilometres of wetlands (EC). Georgian Bay forms part of the northern border and is also the final destination for the water which flows in at Collingwood, Wasaga Beach, and Severn Sound (NVCA). The area has been divided into 10 subwatersheds based on the different river, creek, and sound systems that drain the watershed.

The Townships of Adjala-Tosorontio, Clearview, Essa, Oro-Medonte, and Springwater, and the Towns of Bradford West Gwillimbury, Collingwood, Innisfil, New Tecumseth, and Wasaga Beach in Simcoe County, as well as the City of Barrie, the Towns of Mono and Shelburne, and Townships of Amaranth, Melancthon, and Mulmur in Dufferin County, and the Town of the Blue Mountains and Grey Highlands Municipality in Grey County and Town of Caledon in Peel Region are all represented either fully or partly in this watershed.

There are 26 square kilometres of coastal areas spaced along the 35 kilometres of Georgian Bay’s coastline (EC, NVCA). These areas are important to the tourism industry that is centred in Collingwood and Wasaga Beach. Agriculture covers a large portion of the land, but there are also areas of forest and wetlands (NVCA).

Picture
Nottawasaga Valley Watershed [Picture Source: EC]
   References
  • Environment Canada. (2014, September 5). Lake Simcoe/South-eastern Georgian Bay Clean-Up Fund (LSGBCUF). In Environment Canada - Water - Lake Simcoe Clean-Up Fund. Retrieved September 15, 2014, from http://www.ec.gc.ca/eau-water/default.asp?lang=En&n=85C54DAE-1

  • Nottawasaga Valley Conservation Authority. (2013). 2013 Nottawasaga Valley Watershed Health Check. In Watershed Report Cards. Retrieved September 29, 2014, from http://www.nvca.on.ca/Shared%20Documents/2013%20NVCA%20WHC.pdf


0 Comments

Lake Simcoe Watershed

10/6/2014

1 Comment

 
Part 2 of a 4-part series on watersheds

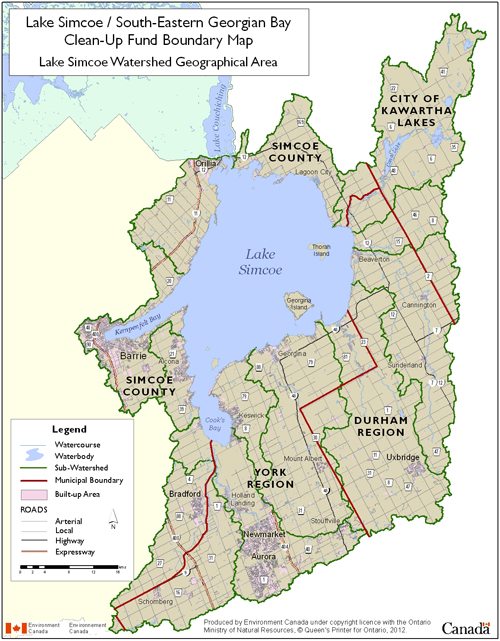
The Lake Simcoe Watershed covers 3,576 square kilometres of land and water including the 722 square kilometres of Lake Simcoe which is part of the Trent-Severn Waterway (EC, LSRCA). There are 4,225 kilometres of rivers, creeks, streams, and tributaries divided into 18 separate subwatersheds (LSCRA). There are 35 rivers in total that empty into the lake and wetlands cover 13% of the watershed (EC, LSRCA)

There are several regions and municipalities within this watershed. The Towns of Aurora, East Gwillimbury, Georgina, Newmarket, and Whitechurch-Stouffville and Township of King in York Region, the Towns of Bradford West Gwillimbury, Innisfil, New Tecumseth, Townships of Oro-Medonte and Ramara in Simcoe County, as well as the Cities of Barrie and Orillia, the Townships of Brock, Scugog, and Uxbridge in Durham Region, the City of Kawartha Lakes, and the Town of Caledon in Peel Region are all included in the watershed to some degree. Certain municipalities lie fully within the borders and others are only partly represented.

The area hosts a permanent population of above 400,000 (LSRCA). The landscape is changing as the population grows and the towns are developing to service their needs. Its location close to Toronto has caused the towns in the southern areas to become bedroom communities for the city. Presently, 8% of the watershed is urban land and 36% is agricultural land (LSRCA). All aspects of Ontario agriculture are represented within this watershed. The Holland Marsh, located in the southwest, is known as the salad bowl of Ontario. It was designated a Specialty Crop Area in 2005 and is protected from urban expansion and non-agricultural uses. Recreational activities, predominately fishing, and tourism centred around the lake contribute $200 million to the local economy each year (EC). This watershed has an evolving landscape and must contend with increasing development.
Picture
Lake Simcoe Watershed [Picture Source: EC]
References
  • Environment Canada. (2014, September 5). Lake Simcoe/South-eastern Georgian Bay Clean-Up Fund (LSGBCUF). In Environment Canada - Water - Lake Simcoe Clean-Up Fund. Retrieved September 15, 2014, from http://www.ec.gc.ca/eau-water/default.asp?lang=En&n=85C54DAE-1

  • Lake Simcoe Regional Conservation Authority. (n.d.). Our Watershed. In The Lake Simcoe Watershed. Retrieved September 22, 2014, from http://www.lsrca.on.ca/about/watershed.php

  • Planscape. (2009). Holland Marsh Agricultural Impact Study (p. 10). Ontario, Canada: Friends of the Greenbelt Foundation & Holland Marsh Growers’ Association.


1 Comment

Introduction to Watersheds

9/29/2014

0 Comments

 
Part 1 of a 4-part series on watersheds

A watershed is the land area from which water is collected and drained into a body of water such as a stream, river, lake, or ocean. The size and shape is determined by geography; hills, moraines, and other tall features form the outskirts of a watershed as the water flows downhill. A larger watershed, such as one draining into a lake can be divided into subwatersheds based upon individual river systems. Several watersheds can be grouped together to form a single watershed for large bodies of water, such as the Great Lakes.

The boundaries of a watershed usually do not coincide with government boundaries. A watershed can then be half in one county and half in another if the county or municipal border is following a river or creek. This creates problems when working within the watershed as it is under two separate governing bodies. It’s common for a watershed to be impacted by the laws of several regions, townships, towns, and cities.

Water is always flowing somewhere, whether quickly or slowly. Issues that arise in an area at the top of a stream will travel down that stream to a river. The river will carry that issue down to a lake. In time, that issue can make its way into the ocean and could grow and change along the way. Any effort made to mitigate problems upstream or at the margins of a watershed will have an impact further down the waterway.

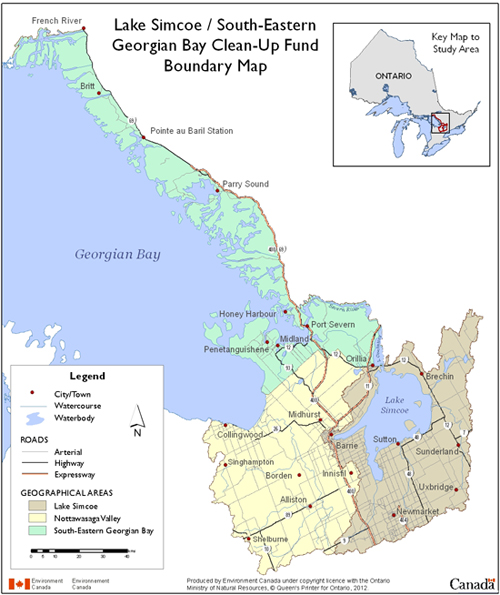
The HMGA-LSGBCUF project is working within three neighbouring watersheds: Lake Simcoe, Nottawasaga Valley, and South-Eastern Georgian Bay, as shown in the map below. Together they cover and influence a vast area of both land and water as well as impact the people who live within them.
Picture
Lake Simcoe, Nottawasaga Valley, and South-Eastern Georgian Bay Watersheds [Picture Source: EC]
References
  • Canadian Geographic. (n.d.). Watershed 101. In Protect your watershed. Retrieved September 23, 2014, from http://www.canadiangeographic.ca/watersheds/map/?path=english/watershed101
  • Environment Canada. (2014, September 5). Lake Simcoe/South-eastern Georgian Bay Clean-Up Fund (LSGBCUF). In Environment Canada - Water - Lake Simcoe Clean-Up Fund. Retrieved September 15, 2014, from http://www.ec.gc.ca/eau-water/default.asp?lang=En&n=85C54DAE-1
  • Lake Simcoe Regional Conservation Authority. (n.d.). Our Watershed. In The Lake Simcoe Watershed. Retrieved September 22, 2014, from http://www.lsrca.on.ca/about/watershed.php
0 Comments

    Project Updates

    Find articles on project-related topics here

    Archives

    December 2016
    October 2016
    September 2016
    July 2016
    June 2016
    May 2016
    April 2016
    March 2016
    February 2016
    January 2016
    December 2015
    November 2015
    October 2015
    September 2015
    August 2015
    July 2015
    June 2015
    May 2015
    April 2015
    March 2015
    February 2015
    January 2015
    December 2014
    November 2014
    October 2014
    September 2014

    Topics

    All
    Aerators
    Coagulation & Flocculation
    Deionization
    Discharge Characterization
    Drum Filter
    Filter Bags
    General Information
    Hydrocyclone
    Lake Simcoe
    Lesson Learned
    Muck
    Nottawasaga Valley
    Pre Treatment
    Pre-Treatment
    Sampling
    Settling Ponds/Tanks
    South-Eastern Georgian Bay
    System Evaluation
    Treatment Technologies
    Ultrafiltration
    Washing Process
    Water Quality Parameters
    Watershed

    RSS Feed

    Article Titles

    Introduction to
      Watersheds

    Lake Simcoe Watershed
    Nottawasaga Valley
      Watershed
    South-Eastern Georgian
      Bay Watershed
    Water, Water,
      Everywhere?
    The Trouble with Muck:
      Size
    Lesson Learned: Bottom-
      up Aerator to Treat
      Washwater in Settling
      Tanks
    Phosphorus, the
      Environment, and
      Farming
    Nitrogen’s Impact on Air,
      Land, and Water
    Water-borne Pathogens
      and Food Safety
    Defining Dissolved
      Oxygen
    Filter Bags
      Demonstration Site
    Organic Matter
      Breakdown &
      Biochemical Oxygen
      Demand
    Dealing with Cloudy
      Water
    Hydrocyclone
      Demonstration Test
    What IS Muck?
    Demystifying Oxidation-
      Reduction Potential
    News Release
      "Technology
      Investigation: Filter
      Bags"
    Drum Filter
      Demonstration Site
    Decomposing With(out)
      Oxygen
    Flow monitoring
    Lesson Learned: Drum
      Filter Optimization
    Polders & the Holland
      Marsh
    Vegetable Washing
      Process
    ​Dry Soil Removal
    Ultrafiltration &
      Deionization
      Demonstration Site
    News Release
      "Technology
      Investigation:
      Ultrafiltration &
      Capacitive Deionization"
    Progressive Passive
      Filtration
    ​Dissolved Air Flotation
    Clarifying the Solid
      Removal Process
    Factsheet Reading Order
    News Release:
      "Technology
      Investigation:
      Coagulation &
      Flocculation"
    Self-Indexing Filter
    Monitoring Discharge
    ​  Flows
    Settling Soil
    Mass Loading
      Calculations
    Lesson Learned:
      Technology Selection
    Electrocoagulation
    Auto-Samplers
Powered by Create your own unique website with customizable templates.