HMGA Water Project
  • Home
  • Project Overview
    • Project Description
    • Project Team
    • Collaborative Projects
    • FAQ
  • Publications
    • Blog
    • Factsheets
    • News Articles
  • Events
  • Gallery
  • Dedirting
  • Contact

Defining Sampling

12/7/2016

0 Comments

 
When taking samples for specific purposes, it may be necessary to have a different plan for each intention. Discrete and composite samples serve different purposes in showing what happens at a single point or over a time span. Sampling over a longer time period such as a day should have a plan outlined prior to taking any samples.
Discrete vs Composite Samples
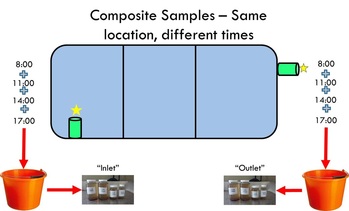
A discrete sample is one sample taken from a single point, at a specific time; this type of sample is also called a ‘grab’ sample.  A composite sample is collected by combining grab samples from one location at different times, or samples from different locations at the same time and combined.  Where discrete samples provide data from a snap shot in time, a composite sample can provide data spread throughout a day. Figures 1 and 2 show examples of how each type of samples are used.
Picture
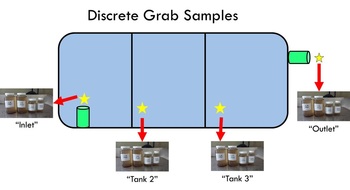
Figure 1: Discrete samples are taken from the inlet pipe, at the overflow points of two cells of a settling tank, and at the outlet pipe.
Picture
Figure 2: A composite sample is taken from the inlet and outlet pipe in a settling tank; samples are taken at several times and grouped together in one bottle submitted to the laboratory.
Regular Sampling Days vs. Intensive Sampling Days
During the length of the HMGA Water Project, two types of sampling days were developed to give a clear picture of the water quality over a day and over three hour intervals.  Regular sampling days involved taking one set of samples at each point of the treatment process with auto-samplers placed at the pre-treatment and post-treatment positions.  Intensive sampling days were often bordered by regular sampling days and grab samples were taken every three hours along with the collection of the composite samples from the auto-samplers. ​
0 Comments

Auto-Samplers

10/18/2016

0 Comments

 
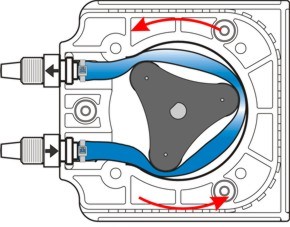
PictureFigure 1: Water movement and composition of a peristaltic pump
Collecting water samples is a key component to the HMGA Water Project as it provides data necessary to compare treatment processes. Samples are taken before anything was added as well as after the installation of new treatment technologies.  By comparing the results, the efficiency of the new technology was determined.

Auto-samplers were introduced during the project in order to collect samples throughout a given production day. They are used to collect samples at various times without the user needing to be present.  Grab samples were collected along with composite samples to provide a clear image of a day’s worth of washing.

HMGA Water Project & Auto-Samplers
The project utilized two types of auto-samplers: the Hach Sigma 900 and the MasterFlex E/C Composite Sampler.  These two auto-samplers were utilized due to their ease of use and reliability. Both types of auto-samplers use peristaltic pumps to pull the water from the collection point through the hose to the bottle. All samples collected using the auto-samplers are composite samples; composite samples are a multitude of single samples combined.  The composite samples were compared to results from manual grab samples.

The auto-samplers were set at varying intervals based on requirements of the day.  On regular sampling days, the auto-samplers were set to take samples every half hour for twelve hours. Alternatively, the auto-samplers were set to draw a sample every ten minutes for three hours during the project’s intensive sampling days.

Peristaltic pumps
As discussed previously, the auto-samplers use peristaltic pumps to draw the water up the hose or tube.  The pump works by pinching a flexible tube around rotors which rotate creating a suction on the water.  As shown in Figure 1, the rotors move in a counter-clockwise rotation, creating suction, thus pulling the water up the tube. 
​
Conclusion
The use of auto-samplers was integral to the success of the HMGA Water Project.  They offer a user-friendly method to take samples that can be used in a variety of situations.  

0 Comments

Electrocoagulation

9/22/2016

0 Comments

 
Some solids are too small to be captured by solid removal techniques. They need to be compounded together in order to make them large enough to be efficiently separated from water. This process is referred to as coagulation and flocculation.

​Electrocoagulation is a method of coagulation and flocculation which applies an electrical charge to make the particles come together by changing the charge on the particles’ surfaces. The wastewater is held in an area where an electrical field is created using charged metal surfaces called anodes and cathodes. Applying the charge to the water destabilizes the bonds holding compounds such as solids and nutrients to water molecules. It will also strip the charge from colloids. These destabilized particles now come together to form a mass. This process will create a stable floc of particles that rises to the surface, a sludge layer on the bottom, and clarified water in the middle. The waste can be removed by skimming from the surface and collecting from the bottom; it can then be dewatered and composted. The clarified water is removed from the center and brought to its next destination.

The alternative to electrocoagulation is using chemicals to coagulate and flocculate. The advantage of electrocoagulation is the waste stream is free of any added compounds. Chemical dosing systems are also greatly dependent on the pH, composition of the water to be treated, and the flow rate. The dose may need to change regularly in response to these factors in order to be fully effective. The disadvantage of electrocoagulation is that it is reliant on a sufficient electrical supply and will require a sludge de-watering system. Both versions of coagulation require on-going inputs, whether be chemicals or electricity.
An electrocoagulation system will require a sufficient and approved electrical supply (a dedicated breaker is suggested), holding tanks, and a waste removal system. The unit itself may be small, but the supporting equipment may require a substantial indoor footprint. It is highly recommended to use a computer system to operate the equipment and install holding tanks to moderate water flow to a consistent rate. On-going inputs will include electricity, sacrificial anode replacements, waste handling, and maintenance.
Videos on Electrocoagulation
​

The video links listed below are for information only. The companies are not being endorsed by the HMGA Water Project.
  • Electrocoagulation 101
  • ​H2O Technologies, Inc. "Electro coagulation Process Video"
  • ​KASELCO Sur-Flo Electrocoagulation Treatment
0 Comments

Lesson Learned: Technology Selection

7/11/2016

1 Comment

 
​Problem: A greenhouse facility wants to reuse water from a flood floor which is used to water potted plants. The water collected has vermiculite and organic matter clouding the water which would clog nozzles and settle in pipes.
 
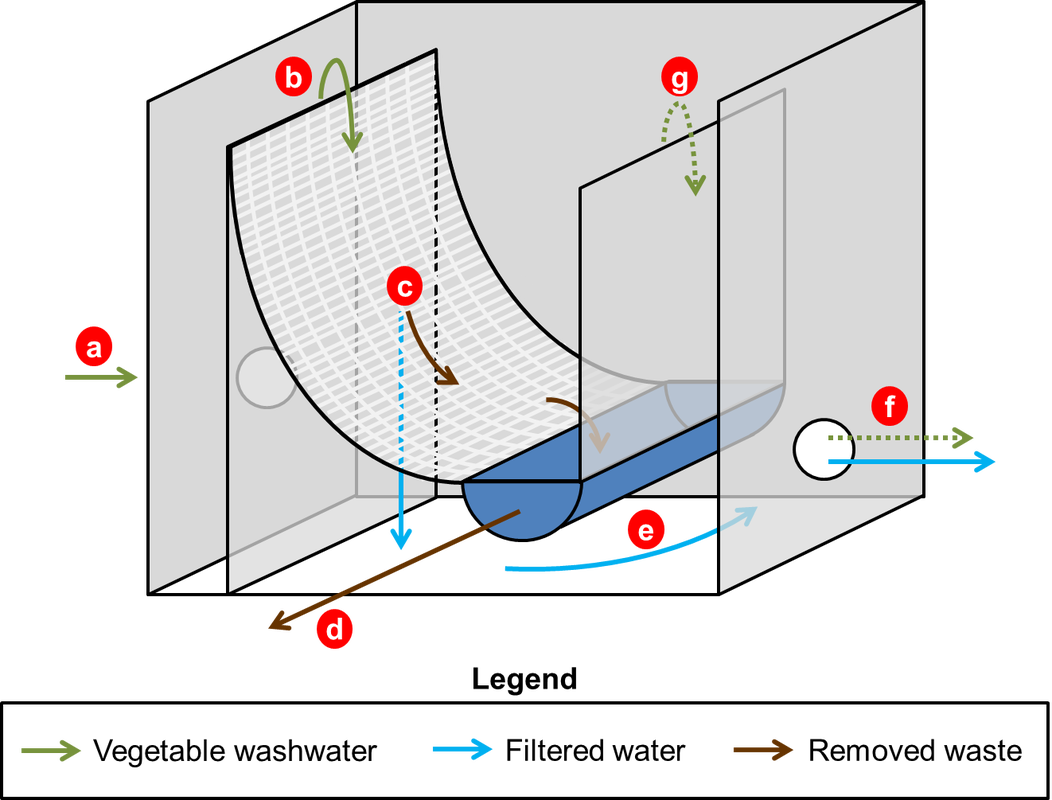
Solution: The operator looked at two different technologies, a self-indexing filter and a parabolic filter screen (Figures 1 & 2). Both are recommended units that filter coarse material from water.
Picture
Figure 1: Diagram of a self-indexing filter [level sensor is tripped when water rises due to clogged paper and roll is unspooled]
Picture
Figure 2: Diagram of a parabolic filter screen [(a) inflow; (b) flows onto screen; (c) waste remains on screen and treated water falls through; (d) waste exits through tray; (e) treated water exits through (f); (g) water overflows if screen becomes clogged and exits through (f)]
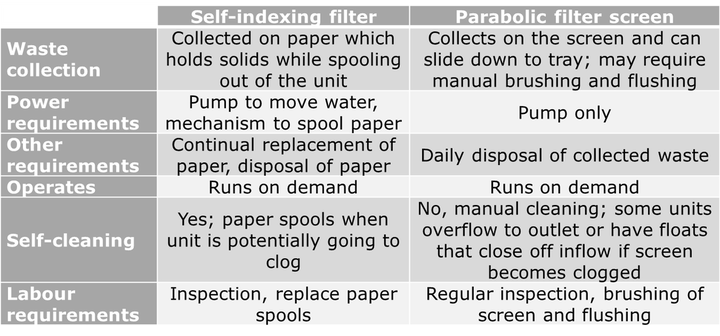
​Discussion: The infrastructure required for either technology is similar; both will need some plumbing and a pump to move water through the treatment system. The technologies are compared in the table below. Both systems will complete the task; the self-indexing filter is more hands-off but requires more inputs. The parabolic filter screen must be supervised but has minimal on-going costs.
Picture
​Decision: The operator choses the self-indexing filter as it requires less regular supervision. The additional energy costs, on-going need of paper rolls, and disposal of paper was preferable to increased labour requirements and disposal of waste.
 
Lesson Learned: When there are multiple technologies that could fit in a treatment system it is important to investigate all aspects. Decisions should be made based on more factors than merely cost.
1 Comment

Mass Loading Calculations

7/6/2016

0 Comments

 
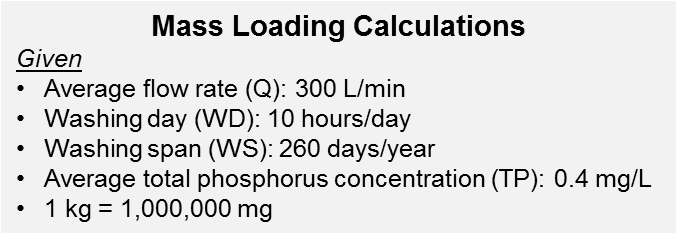
The mass loading of a discharge is a useful tool in selecting and sizing treatment equipment. The calculation is completed by comparing the daily flow rates with values obtained from water quality sampling and analysis.

Often times, concentrations of parameters from water quality sampling provide results in mg/L. The flow measurements are recorded in L/min; the official designation for flow in calculations is ‘Q’. With the addition of the time period of the water, all the variables to calculate mass loading are present.

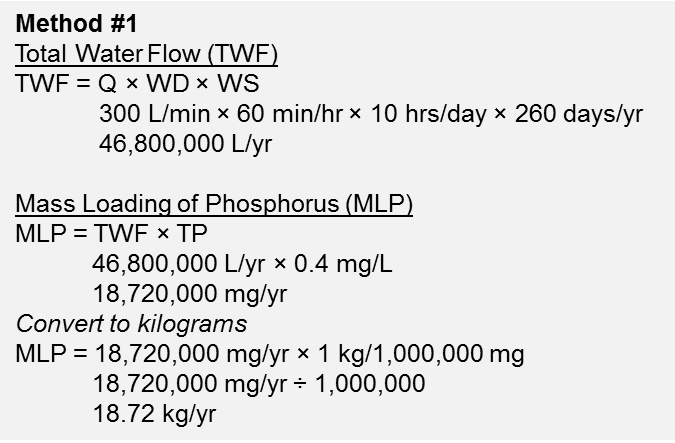
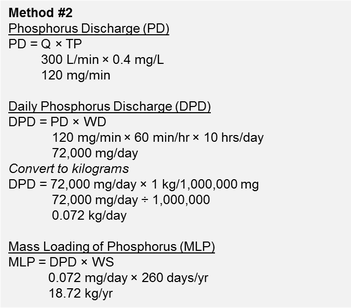
There are multiple methods to reach the final number; two of the possible ways are presented to the right.

​Calculating the mass loading of a water stream is vital stage of water characterization. It will be important when creating a treatment system, deciding how to handle the waste stream, and discharging or re-purposing the final water.

More information on measuring flows is available in 'Monitoring Discharge Flows'. Instructions on sampling procedures can be found in Factsheet #006 Water Sampling & Proper Procedures.
Picture
Picture
Picture
0 Comments

Settling Soil

7/5/2016

1 Comment

 
Read about how to complete a jar test in ‘The Trouble with Muck: Size’.
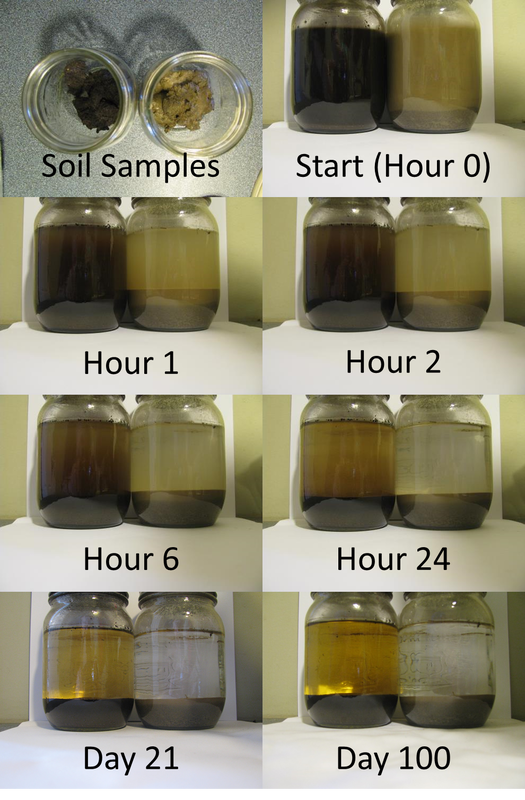
Throughout the project there have been discussions about the different lengths of time it takes to settle different soil types. In general sand settles the quickest followed by silt, clay, and lastly, muck. To demonstrate this process, jar tests were done with a mineral and muck soil sample. Jar tests are simply soil added to water and left to settle. The depth of the water to the top of the sediment layer was measured as 2 1/8”.

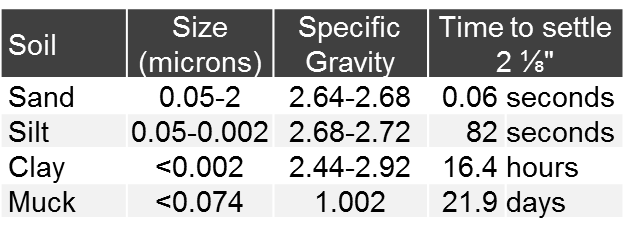
​The test was evaluated by taking pictures of the two jars at regular intervals (Figure 1). Calculations were done to predict when the various soils would settle out of the water, shown in Figure 2. As expected, the order in which they settled was sand first, then silt, clay, and finally muck. The sand settled so quickly it was impossible to get a picture with it still in suspension. The silt followed soon after and then took a period of time to fill in the spaces between the sand particles. Clay can be seen in suspension in Hour 6 but has cleared in Hour 24.


The calculations predicted that the muck would have settled in 22 days. While most of it cleared by the 21st day, the picture taken on the 100th day shows that there are still particles in suspension.

​Lastly, in both jars there is a layer of organic matter floating on the surface. These particles have made no downward movement through the time period.


The jars will continue to be monitored to determine whether the colour clears from the jar containing the muck soil.
Picture
Figure 1: The soil samples placed in Mason jars for the soil settling test and results over 100 days
Picture
Figure 2: Size and specific gravity of sand, silt, clay, and muck, and the average time to settle 2 1/8"
1 Comment

Monitoring Discharge Flows

7/4/2016

0 Comments

 
For a general description of the process see 'Flow Monitoring'.

Introduction
Flow meters were utilized throughout the HMGA Water Project in order to determine water flows generated by processing carrots and other root vegetables. These values are used to properly size treatment equipment.
Components
The flow meters used included the Hach FL900AV meter with Hach Flow-Tote 3 AV sensor. The two components communicate with one another via a cable to measure and record. The Hach flow meters were chosen due to their reliability, ease of use, and their ability to determine flow in a variety of conditions. Often the water being discharged from the facility would have high solids content which would likely cause improper readings if other types of sensors had been used (mechanical sensors would likely get clogged/jammed for example). This flow sensor has three electrodes pointing out of the sensor base which are designed in such a way as to prevent the build-up of debris on the sensor. Pipe bands are used to secure the Flo-Tote 3 sensor inside an outlet pipe; they ranged in size from 8” to 14”, but other sizes are available.
Picture
(Top left) Hach FL900AV meter and Hach Flow-Tote 3 AV sensor; (Top Right) Hach Flow-Tote 3 AV sensor with three protruding electrodes; (Bottom left) Sensor installed on pipe band; (Bottom right) Band and sensor placed in the discharge pipe.
The Hach Flo-Tote 3, installed in a pipe, acts as the sensor which measures velocity and level of water. The sensor sends velocity and depth measurements through the cable to the Hach FL900AV meter which calculates flow and acts as a data logger. The data is stored for several days until it is downloaded to a computer. The Hach FL900AV meter is powered by four 6V lantern batteries. The unit is based on the principals of Faraday’s Law of electromagnetic induction. As the water moves through a magnetic field created by the sensor, it produces a voltage which is then recorded. The faster the water, the higher the voltage produced. Using the voltage, a velocity is determined. Flow is calculated by multiplying the velocity by the area of the pipe (Q=AV). The level of water in the pipe is measured using a pressure transducer. The transducer is made up of a thin diaphragm which converts exerted pressure to an electronic signal.

​The software used to compile data, FSData Desktop Instrument Manager, allows the user to graph flow, velocity, and water level. An exporting function is also available to convert data to a .csv file which is compatible with Microsoft Excel.  FSData is also used to calibrate the instrument at installation.
 
Limitations
The flow sensors could not be placed in pipes with a diameter less than 8” due to the width of the sensor, water would flow beneath the flow sensor due to the curve of the pipe. It can operate between -18°C to 60°C. The accuracy of the Flo-Tote 3 sensor was ±2% of reading.
 
Installation and Use
An appropriate band is chosen based on the pipe diameter. The Flo-Tote 3 sensor is attached to the band using screws and the cable from the sensor is affixed to the back of the band using zip-ties with ends snipped in order to have minimal effect on the flow. The sensor and band are then placed into the outlet pipe as far in as possible to minimize turbulence and create a streamlined flow. Lastly the sensor is connected to the logger.

The logger is then connected to the computer using FSData Desktop Instrument Manager. The Set-Up Wizard found within FSData requires the pipe diameter and current water level measurements be manually measured and inserted into the program. This is required once at initial start-up.

​Logging measurements can be set at variable time intervals to suit the application; for example, readings can be taken every 60 seconds. In such cases, there is a need for greater program memory to capture data over longer periods of times. The data is collected by connecting the Hach FL900AV meter to a laptop computer via a cable.

Taking flow measurements in regular intervals provides a clear description of a set period of flow. Peak flows will be displayed as well as regular flow conditions.

Reference
  • Hach Company (2013). Flo-Tote 3 sensor: Open channel flow sensor – User manual. Retrieved from http://www.hachflow.com/pdf/Flo-Tote3Man.pdf on 22 June, 2016.
0 Comments

Self-Indexing Filter

6/6/2016

0 Comments

 
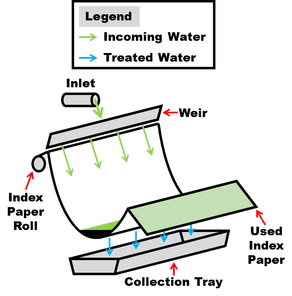
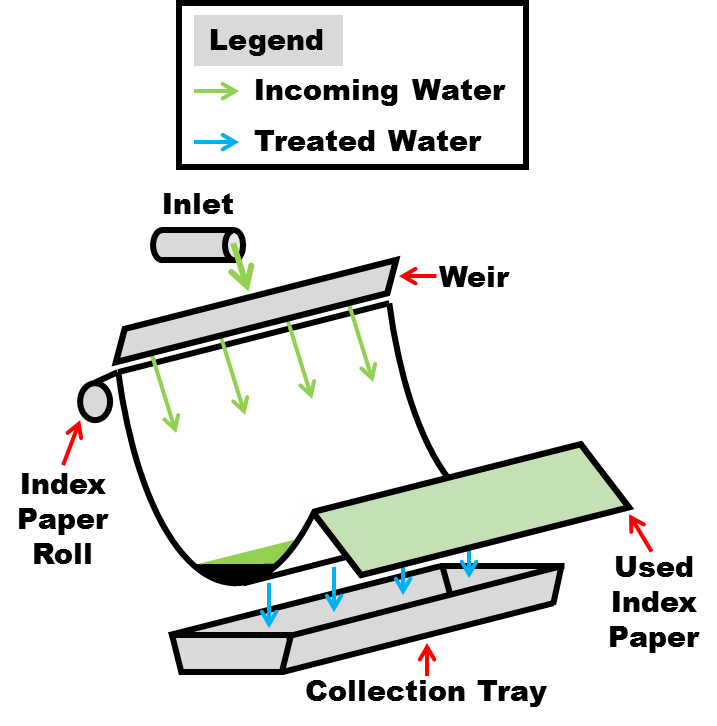
A self-indexing filter is a system that uses filter paper to remove solids from water. The unit works by feeding a filter paper media off a roll and laying it on a mesh support that forms a trough. Water is either gravity-fed or pumped through an inlet where it is distributed across the width of the roll so that it is evenly released onto the paper. The water flows down the paper and settles into the base of the trough where the solids in the water are captured by the filter and the water falls through into a collection tray. The solids will eventually clog the filter media and cause the water level to rise. Once a pre-set level sensor is reached, the media will be ‘indexed’; new paper will be fed off the roll to replace the clogged media in the trough. The removed solids are trapped within and on the filter media and will stay with it as it is rolled out of the unit. The paper and solids will then dry and can be disposed.
Picture
Figure 1: Components of and incoming and treated water flows through a self-indexing filter
There are advantages and disadvantages to this system. The amount of paper necessary will depend on the amount of solids in the water; more solids will mean more paper being used. The paper traps the solids and both can be disposed of together. It is automated equipment and can be run with minimal operator input. The pore size of the media can range in size from less than 10 microns to 200 microns so it can be customized to a facility’s needs. This system is a proven technology and available from multiple suppliers.
​

References
  • Clearstream Filters Inc. (2009). Operation Manual Myco Self Indexing Unit. In Myco Media Filter. Retrieved April 29, 2016, from http://www.clearstream.ca/mmfmanual.pdf
  • Water Maze. (2016). Mechanical Filtration. In Wastewater Technology. Retrieved April 29, 2016, from http://www.wmaze.com/wastewater-technology.aspx
0 Comments

News Release: "Technology Investigation: Coagulation & Flocculation"

5/3/2016

0 Comments

 
Picture
The HMGA Water Project evaluated coagulation and flocculation systems for removing fine solids from washwater. They were used in conjunction with large solid removal technologies and compared to other systems with no added chemicals. A summary of the tests and results are available in the article below.
Technology Investigation: Coagulation & Flocculation
File Size: 520 kb
File Type: pdf
Download File

0 Comments

Factsheet Reading Order

4/11/2016

29 Comments

 
This project has produced an array of factsheets on a range of topics. Below is the list grouped into topics and arranged in a suggested reading order. The documents can be found here, unless otherwise noted.
 
Water Qualities
#012 Water Quality Standards in Agriculture
#001 Water Quality Parameters for Vegetable Washwaters
 
Regulatory Considerations
#004 Considerations when Determining Discharge Limits
#018 Selecting a Laboratory
#006 Water Sampling & Proper Procedures
#009 Regulatory Permitting & Compliance
 
Technology Considerations
#016 Design Considerations for Vegetable Washwater Treatment Systems
#007 Choosing Washwater or Water Treatment Technologies
#002 Impact of Muck Soils on Water Treatment Systems
 
Large Solid Removal
#014 Large Solid Removal for Effective Treatment
Technology Investigation: Filter Bags (available here)
#005 Settling Ponds & Tanks
#008 Drum Filters
#010 Hydrocyclones & Centrifuges
 
Small Solid and Nutrient Removal
#003 Coagulation & Flocculation
#013 Biofiltration
Technology Investigation: Ultrafiltration & Capacitive Deionization (available here)

Polishing and Dosing
#011 Bottom Aeration
#017 Surface Aeration
#015 Water Treatment Technology Options for Washing Vegetables
29 Comments
<<Previous

    Project Updates

    Find articles on project-related topics here

    Archives

    December 2016
    October 2016
    September 2016
    July 2016
    June 2016
    May 2016
    April 2016
    March 2016
    February 2016
    January 2016
    December 2015
    November 2015
    October 2015
    September 2015
    August 2015
    July 2015
    June 2015
    May 2015
    April 2015
    March 2015
    February 2015
    January 2015
    December 2014
    November 2014
    October 2014
    September 2014

    Topics

    All
    Aerators
    Coagulation & Flocculation
    Deionization
    Discharge Characterization
    Drum Filter
    Filter Bags
    General Information
    Hydrocyclone
    Lake Simcoe
    Lesson Learned
    Muck
    Nottawasaga Valley
    Pre Treatment
    Pre-Treatment
    Sampling
    Settling Ponds/Tanks
    South-Eastern Georgian Bay
    System Evaluation
    Treatment Technologies
    Ultrafiltration
    Washing Process
    Water Quality Parameters
    Watershed

    RSS Feed

    Article Titles

    Introduction to
      Watersheds

    Lake Simcoe Watershed
    Nottawasaga Valley
      Watershed
    South-Eastern Georgian
      Bay Watershed
    Water, Water,
      Everywhere?
    The Trouble with Muck:
      Size
    Lesson Learned: Bottom-
      up Aerator to Treat
      Washwater in Settling
      Tanks
    Phosphorus, the
      Environment, and
      Farming
    Nitrogen’s Impact on Air,
      Land, and Water
    Water-borne Pathogens
      and Food Safety
    Defining Dissolved
      Oxygen
    Filter Bags
      Demonstration Site
    Organic Matter
      Breakdown &
      Biochemical Oxygen
      Demand
    Dealing with Cloudy
      Water
    Hydrocyclone
      Demonstration Test
    What IS Muck?
    Demystifying Oxidation-
      Reduction Potential
    News Release
      "Technology
      Investigation: Filter
      Bags"
    Drum Filter
      Demonstration Site
    Decomposing With(out)
      Oxygen
    Flow monitoring
    Lesson Learned: Drum
      Filter Optimization
    Polders & the Holland
      Marsh
    Vegetable Washing
      Process
    ​Dry Soil Removal
    Ultrafiltration &
      Deionization
      Demonstration Site
    News Release
      "Technology
      Investigation:
      Ultrafiltration &
      Capacitive Deionization"
    Progressive Passive
      Filtration
    ​Dissolved Air Flotation
    Clarifying the Solid
      Removal Process
    Factsheet Reading Order
    News Release:
      "Technology
      Investigation:
      Coagulation &
      Flocculation"
    Self-Indexing Filter
    Monitoring Discharge
    ​  Flows
    Settling Soil
    Mass Loading
      Calculations
    Lesson Learned:
      Technology Selection
    Electrocoagulation
    Auto-Samplers
Powered by Create your own unique website with customizable templates.