HMGA Water Project
  • Home
  • Project Overview
    • Project Description
    • Project Team
    • Collaborative Projects
    • FAQ
  • Publications
    • Blog
    • Factsheets
    • News Articles
  • Events
  • Gallery
  • Dedirting
  • Contact

Factsheet Reading Order

4/11/2016

28 Comments

 
This project has produced an array of factsheets on a range of topics. Below is the list grouped into topics and arranged in a suggested reading order. The documents can be found here, unless otherwise noted.
 
Water Qualities
#012 Water Quality Standards in Agriculture
#001 Water Quality Parameters for Vegetable Washwaters
 
Regulatory Considerations
#004 Considerations when Determining Discharge Limits
#018 Selecting a Laboratory
#006 Water Sampling & Proper Procedures
#009 Regulatory Permitting & Compliance
 
Technology Considerations
#016 Design Considerations for Vegetable Washwater Treatment Systems
#007 Choosing Washwater or Water Treatment Technologies
#002 Impact of Muck Soils on Water Treatment Systems
 
Large Solid Removal
#014 Large Solid Removal for Effective Treatment
Technology Investigation: Filter Bags (available here)
#005 Settling Ponds & Tanks
#008 Drum Filters
#010 Hydrocyclones & Centrifuges
 
Small Solid and Nutrient Removal
#003 Coagulation & Flocculation
#013 Biofiltration
Technology Investigation: Ultrafiltration & Capacitive Deionization (available here)

Polishing and Dosing
#011 Bottom Aeration
#017 Surface Aeration
#015 Water Treatment Technology Options for Washing Vegetables
28 Comments

Clarifying the Solid Removal Process

3/28/2016

4 Comments

 
Picture
Figure 1: Examples of creaming in settling tanks
When working with small particle removal, experience has shown that the addition of chemical coagulants or flocculants is usually a necessity. The question is what is the best method of applying this system?

First, all the applicable terms need to be defined:
  1. Clarification: this term can be used to describe the overall process of removing fine particles from water
  2. Coagulation: is the act of neutralizing the charges of particles that allow them to repel each other.
  3. Flocculation: occurs when neutralized (coagulated) particles are brought together to form larger compounds called ‘flocs’
  4. Sedimentation: separating solids from water through settling
  5. Creaming/Flotation: separating solids from water by floating them to the surface
  6. Dewatering: separating solids from water through filtration

The first stage in the clarification of water is coagulation. When small particles are involved, coagulation usually has to be achieved through the addition of chemical aids. The next stage is flocculation and whether or not another chemical is required here is dependent on the particles and the desired speed of floc formation. The final stage is separating the flocs from the water.
Picture
Figure 2: Coagulation, flocculation, creaming, sedimentation, and dewatering
Floc separation can occur three different ways: sedimentation, creaming, or dewatering. The method chosen will depend on the type of flocs as some will naturally sink and others will prefer to float. It is important to match the coagulant and flocculant chemicals, floc behaviour, and method of separation to make a clarification system operate properly and efficiently.
Each separation method has its own challenges including infrastructure needs. Sedimentation is most commonly completed using a settling tank. The separated solids will need to be scooped out regularly so the tank has sufficient room to collect solids. Creaming is associated with air flotation where solids either naturally float or are aided with dissolved air carrying solids upwards. The solids are then skimmed off the water surface. Dewatering uses filters to collect the solids behind a membrane. The membrane will require regular cleaning or replacement when the solids clog the pores. Water used to clean the membranes will also need to be considered for further treatment.
References
  • Tramfloc, Inc. (2014). Selecting Polymers, Jar Testing Procedures. In Flocculants. Retrieved March 14, 2016, from http://tramfloc.com/polymers-selection-jar-testing-procedures/
  • GE Power & Water. (2012). Chapter 05 - Clarification. In Handbook of Industrial Water Treatment. Retrieved March 14, 2016, from http://www.gewater.com/handbook/ext_treatment/ch_5_clarification.jsp
4 Comments

Polders & the Holland Marsh

9/8/2015

1 Comment

 
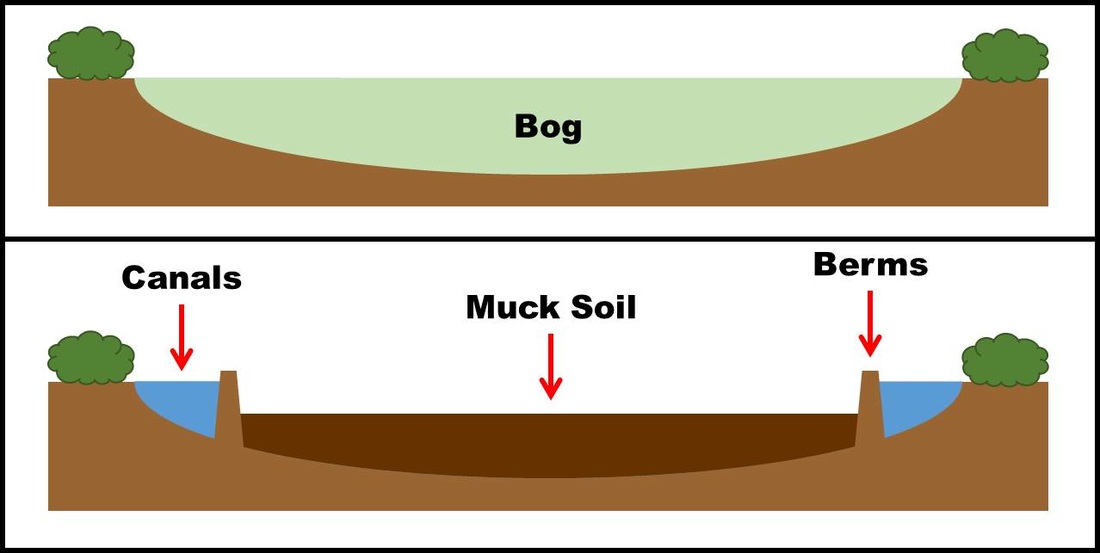
A polder is an area of low-lying land that has been reclaimed from a body of water and is protected by dyke and pump systems. Once the land to be reclaimed has been selected, dykes are built around the area. The water within the dykes is then pumped out of the area into a system of constructed canals (Figure 1). The land remaining is below the natural water level and pumps are used to continually remove water from the area. The polder is physically separate from the surrounding water system as the inflow and outflow are controlled through pumping stations. Natural seepage from ground water also contributes to maintaining soil moisture.
Picture
Figure 1: Side view of a bog (top) turned into a polder (bottom)
The Dutch are well-known for their polders. They have reclaimed sea beds using this technique, holding back the sea with large dyke systems and pumps that were once powered by windmills. Other polders can be built to reclaim land from lakes, rivers, or bogs. Rich, fertile soils reside within these polders; once drained, polders have clay or muck soils, or a combination of the two. The land is largely flat and treeless, which is very suited to agriculture. 
Picture
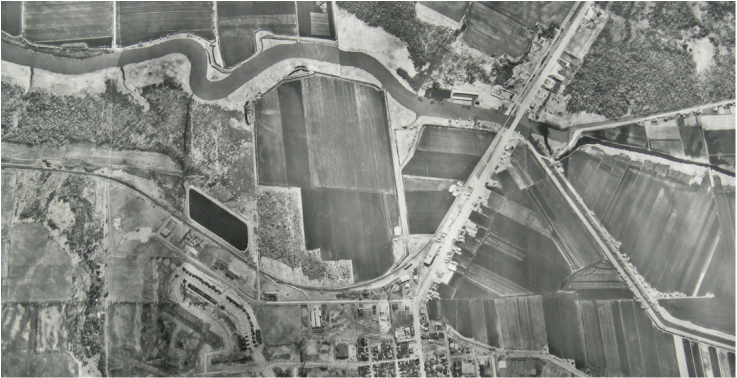
Figure 2: Overhead view of the northern end of Holland Marsh where the canals converge with the Holland River at the pumphouse [date unknown]
Draining the Holland Marsh, named for the first Surveyor General of Upper Canada Major Samuel Holland, was a project led by Professor William Day of the Ontario Agricultural College beginning in 1925. The 28 km of canals dug then now protects 7,000 acres of prime muck soil. Pumping stations, one situated at the North Branch and the other at the northern end keep the water level low enough to keep the land dry. There is an additional 2,500 acres in smaller polders along the Holland River as it runs north to Lake Simcoe.
1 Comment

What IS Muck?

4/13/2015

6 Comments

 
Muck soils are a unique soil type that exists in pockets across Ontario including in the Holland Marsh and surrounding marshes, Keswick, Thedford, Grand Bend, and Leamington Marshes. They are found in low-lying areas, usually bogs or marshes, which have been drained. The organic matter, commonly peat, that is found in the bottom of these bogs forms the basis of the soil. The peat base also gives the soil a spongy texture which is most noticeable when walking through a field and feeling the bounce. It has several characteristics that separate it from mineral soil including colour, organic matter content, fertility, and size.
Picture
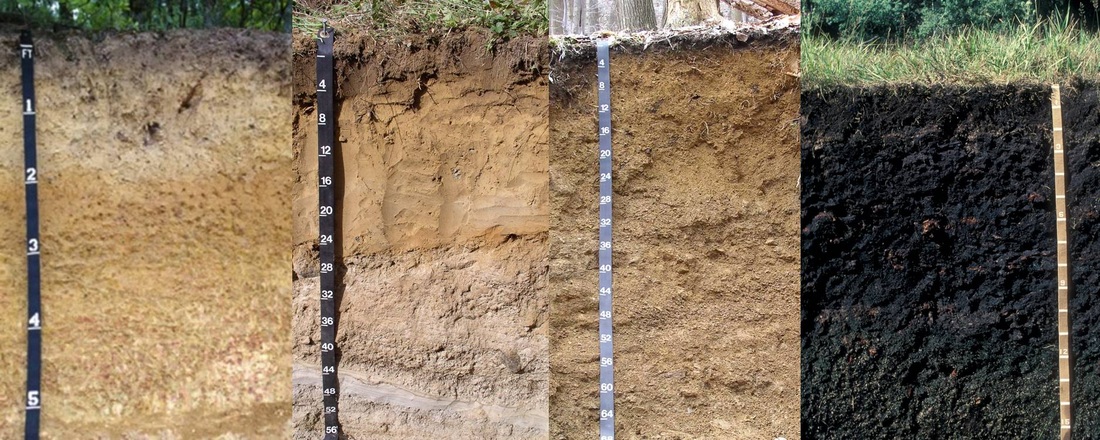
Figure 1: Examples of (from left to right) sandy, silty, clay, and muck soils. [Sources: http://www.nrcs.usda.gov/wps/portal/nrcs/detail/soils/survey/office/ssr7/tr/?cid=nrcs142p2_047969 / http://nesoil.com/images/enfieldRI.htm / http://www.nrcs.usda.gov/wps/portal/nrcs/detail/nj/soils/?cid=nrcs141p2_018867 / http://www.cals.uidaho.edu/soilorders/histosols_04.htm ]
Picture
These soils are easily identified by their colour (Figure 1). Muck has a high concentration of tannins which gives it the distinct black colour. Organic matter, which can be divided into three categories of plant residues and living microbes, detritus, and humus, form less than 10% of mineral soils (CUCE, 2008). Muck soils are made up of between 20 and 80% organic matter. Soil fertility is tied directly to the decomposition of plant residues, dead microbes, and detritus; because of the greater proportion of organic matter present, muck soils are more fertile than mineral soils (CUCE, 2008).
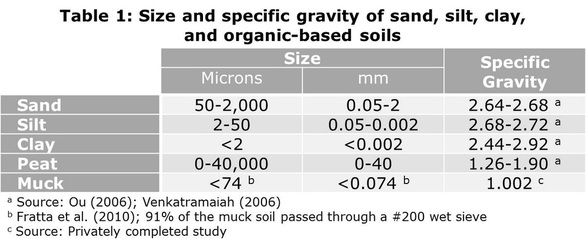
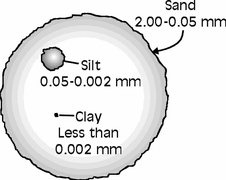
Muck soils are comparatively similar to clay and silt particles in size, but have less than half the specific gravity of them (Table 1). The muck particles also don’t aggregate like mineral soils. Thus, even though individual particles of mineral soils can be quite small, the aggregation will create a larger mass. The lack of aggregation in muck soils combined with the low specific gravity means that muck is susceptible to being picked up by the wind and blown around, creating something that is similar to a sand storm.
Picture
Figure 2: Particle size of sand, silt, and clay. [Source: http://croptechnology.unl.edu/Image/NolanDiane1129928529/figure2-2.jpg]
References
  • Cornell University Cooperative Extension. (2008). Soil Organic Matter. In Agronomy Fact Sheet Series. Retrieved December 5, 2014, from http://franklin.cce.cornell.edu/resources/soil-organic-matter-fact-sheet
  • Ou, C.-Y. (2006). Deep excavation: Theory and practice (p. 8). London, UK: CRC Press.
  • Venkatramaiah, C. (2006). Geotechnical Engineering (3rd ed., p. 32). New Delhi, India: New Age International.
  • Fratta, D. O., Puppala, A. J., & Muhunthan, B. (2010). GeoFlorida 2010: Advances in analysis, modeling & design (p. 2753). N.p.: ASCE Publications.
6 Comments

Nitrogen’s Impact on Air, Land, and Water

12/1/2014

0 Comments

 
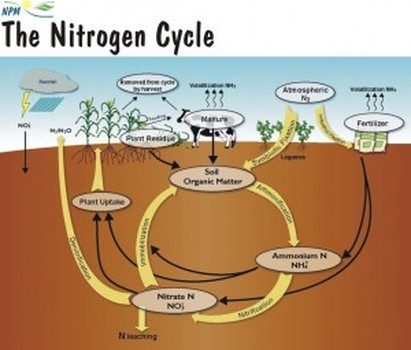
Nitrogen is an essential nutrient for the survival and growth of most living organisms.  Nitrogen gas is a large constituent of the atmosphere, making up approximately 80% of the air, but this form is inaccessible by most plants. Certain bacteria in soils have the ability to ‘fix’ naturally-occurring nitrogen from the atmosphere, which converts it to a usable form for the plants, it can also be fixed by lightning or through an industrial process which makes nitrogen fertilizers. Nitrogen is generally the limiting nutrient in terrestrial ecosystems, and is applied to fields through use of fertilizers and manure. Once in the soil, the nitrogen will be used by the crops, leached down, or emitted into the atmosphere. In the soil, ammonium (NH4+) or ammonia (NH3) is broken down by bacteria through nitrification in which it is converted first to nitrite and then to nitrate. 
Picture
Figure 1: The Nitrogen Cycle [Source: http://fyi.uwex.edu/discoveryfarms/2010/10/fall-can-be-a-good-time-for-nutrient-application-with-awareness-of-conditions/]
Both nitrites (NO2-) and nitrates (NO3-) are highly soluble forms of nitrogen and thus are transported easily in water and do not attach to the soil. Nitrite is more toxic than nitrate but since the processes changing nitrite to nitrate happen quickly it is not generally found in large quantities. Though less toxic, high concentrations of nitrate in aquatic systems can have both acute and chronic lethal effects on amphibians as well as any species which prey on amphibians, such as fish. NH3 which has not been converted through nitrification can also have harmful effects on aquatic organisms. The major sources of NH3 in aquatic systems are wastewater and treatment plants. 
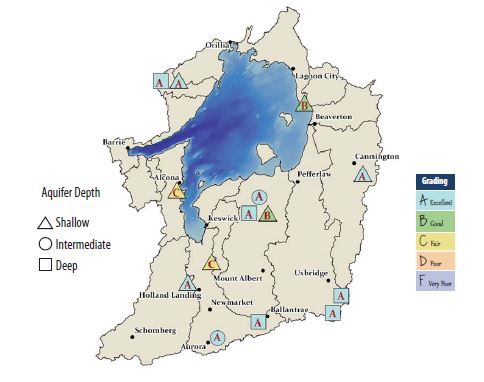
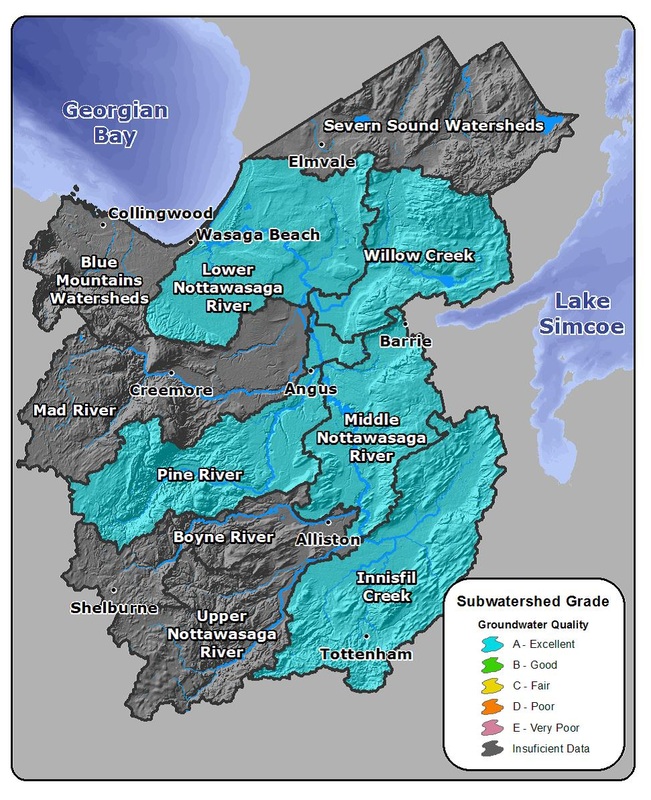
In both the Lake Simcoe Region (Figure 2) and Nottawasaga Valley (Figure 3) watersheds, the groundwater quality ranges from fair to excellent, with fair ratings due to chlorine amounts as opposed to NO2- + NO3- levels. This means that the Holland Marsh, an intensive agricultural area, contributes low amounts of NO2- + NO3-.
Picture
Figure 2: Groundwater Quality in the Lake Simcoe Watershed 2013 [Source: Lake Simcoe Region Conservation Authority, 2013]
Picture
Figure 3: Groundwater Quality in the Nottawasaga Valley Watershed 2013 [Source: Nottawasaga Valley Conservation Authority, 2013]
References
  • Lake Simcoe Region Conservation Authority. 2013. Lake Simcoe Watershed Report Card 2013. Newmarket, ON http://www.lsrca.on.ca/about/watershed_report_card.php
  • Nottawasaga Valley Conservation Authority. 2013. Nottawasaga Valley Watershed Report Card 2013. Utopia, ON http://www.nvca.on.ca/watershed-science/watershed-report-cards
  • Ontario Ministry of Agriculture and Rural Affairs. 2005. Factsheet - Environmental Impacts of Nitrogen Use in Agriculture. Order No. 05-073. Guelph, ON http://www.omafra.gov.on.ca/english/engineer/facts/05-073.htm#5
  • Rouse, J.D., Bishop, C.A., & J. Struger. 1999. Nitrogen Pollution: An Assessment of Its Threat to Amphibian Survival. Environ Health Perspect 107:799-803
  • Environment Canada. 2013. Ammonia Dissolved in Water. CAS (Chemical Abstract Service) registry number: 7664-41-7 https://www.ec.gc.ca/toxiques-toxics/Default.asp?lang=En&n=98E80CC6-0&xml=E9537B48-E09B-4FCF-8A56-F1F44B97FAE4
0 Comments

Phosphorus, Farming, and the Environment

11/24/2014

1 Comment

 
Phosphorus is an essential nutrient for plants as no other nutrient can replace it in its roles in plant growth. It plays a key role in several plant processes but its primary purpose is to store and transfer the energy produced by photosynthesis. When phosphorus is deficient the plants will be stunted and can have a darker green colour than normal. Since it is also involved in the transformation of starches and sugars, under deficient conditions sugars can accumulate and create reddish-purple blotches.
Picture
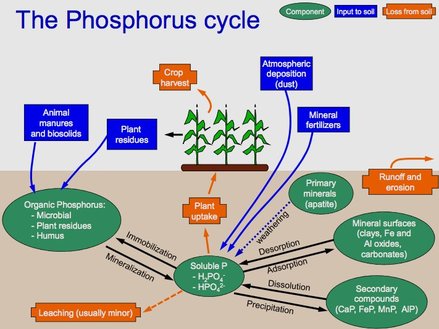
Figure 1: The terrestrial phosphorus cycle [Source: http://upload.wikimedia.org/wikipedia/en/9/91/Phosphorus_Cycle_copy.jpg]
Phosphorus has a permanent place on fertilizer recommendations as it is regularly found to be deficient. The most common source is mined rock phosphate which is processed to produce the fertilizer that is spread on fields. It comes either as solely phosphorus (Superphosphate) or combined with Nitrogen (MAP or DAP). After application the phosphorus has several fates, as shown in Figure 1; it can leach down, be taken up by plants and then off the field with the crop, or it can be removed through run-off or erosion.

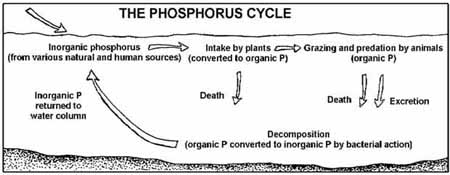
While a useful nutrient for growing terrestrial plants, phosphorus is also the limiting nutrient in aquatic ecosystems. An increased concentration supports a larger population of algae which can cause problems for other organisms. When the algae die off, the oxygen that is used during the decomposition is no longer available for plants, fish, or animals.
Picture
Figure 2: The aquatic phosphorus cycle [Source: http://upload.wikimedia.org/wikipedia/en/e/eb/Phoscycle-EPA.jpg]
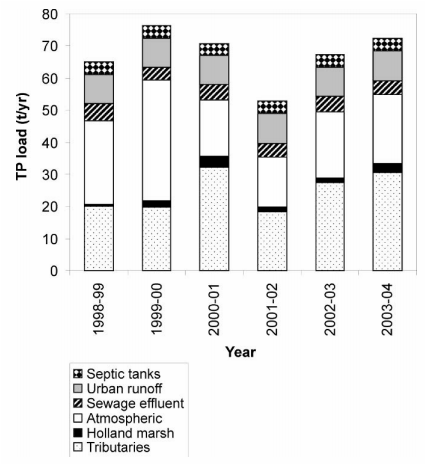
A study completed by Winter et al. (2007) evaluated the major sources of phosphorus to Lake Simcoe from 1998 to 2004 which included septic tanks, urban runoff, sewage effluent, atmospheric, the Holland Marsh, and tributaries. Of these sources the Holland Marsh, an intensive area of agriculture, contributed the least amount, between 1 and 5%, over the studied years in comparison to the other sources (Figure 3). 
Picture
Figure 3: The major sources of total phosphorus to Lake Simcoe for hydrologic years 1998/99-2003/04 (Winter et al., 2007)
References
  • MSU Extension Service. (2014, August 21). Why is my young corn stunted and purple?. In Corn in Mississippi. Retrieved from http://msucares.com/crops/corn/corn_stunted.html
  • Plant and Soil Sciences eLibrary. (2014). Importance of Phosphorus to Plants. In Soils - Part 6: Phosphorus and Potassium in the Soil. Retrieved from http://passel.unl.edu/pages/informationmodule.php?idinformationmodule=1130447043&topicorder=2&maxto=15&minto=1
  • Rehm, G., Schmitt, M., Lamb, J., Randall, G., & Busman, L. (2002). Understanding phosphorus fertilizers. In University of Minnesota Extension. Retrieved October 9, 2014, from http://www.extension.umn.edu/agriculture/nutrient-management/phosphorus/understanding-phosphorus-fertilizers/
  • Winter, J. G., Eimers, M. C., Dillon, P. J., Scott, L. D., Scheider, W. A., & Willox, C. C. (2007). Phosphorus inputs to Lake Simcoe from 1990 to 2003: Declines in tributary loads and observations on lake water quality. Journal of Great Lakes Research, 3(2), 381-396.
1 Comment

Water, Water, Everywhere?

10/28/2014

0 Comments

 
Canada is the second most water-rich of the OECD countries with 85,516 cubic metres of renewable freshwater per capita. However, 60% of this water is unavailable to 85% of the population as it flows north away from the city centres. With this in mind, Canada still ranks fourth. It is also the second highest water user at 1,441 cubic metres per capita. Even with high water usage, only 2% of the renewable freshwater resources are withdrawn from the source annually. Ninety-six percent of the water comes from surface sources such as lakes and rivers and the remaining 4% is taken from groundwater sources. From 1985 to 1995 the amount of water withdrawn from these sources annually dropped 0.4% and in 1996 it was estimated that 20% of the water went to domestic and household use, 69% to industrial and commercial uses, and 12% to irrigation and agriculture.

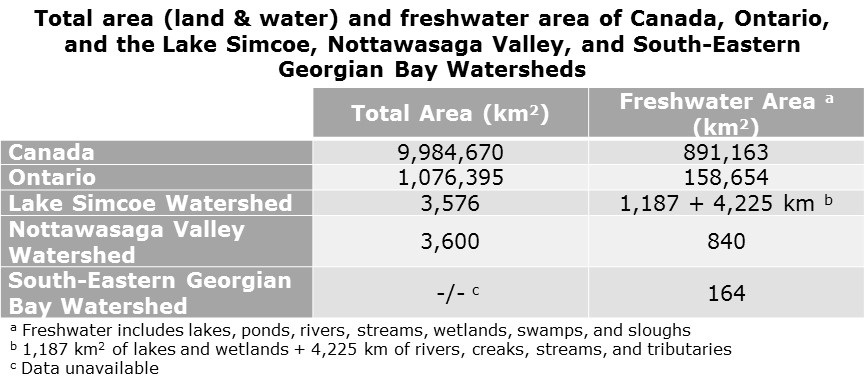
The breakdown of land and water surface area is shown below. Canada and Ontario have 8.9 and 14.7% respectively of their total area in freshwater, which is made up of lakes, ponds, rivers, streams, wetlands, swamps, and sloughs (CWF [1]). The Lake Simcoe and Nottawasaga Valley Watersheds have 33 (lake and wetlands only) and 23% respectively of their land area under water (EC).

Canada has a large supply of freshwater but is also one of the highest users of water. Even though overall the country has vast amounts, the distribution is uneven and access is limited in some areas. Challenges moving forward for the country, the province, and these watersheds include an increasing demand as the population grows and combating pollution while protecting the freshwater sources.

Unless otherwise noted, data is sourced from CWF [2]
Picture
[Data adapted from CWF [1] and EC]
References
  • Canada West Foundation & Vander Ploeg, C. G. [1] (2011, September). Canada’s Waterscape in Context. In Canadian Water Policy Backgrounders. Retrieved October 6, 2014, from http://cwf.ca/pdf-docs/publications/Water_Backgrounder_2_Sept_2011.pdf
  • Canada West Foundation & Vander Ploeg, C. G. [2] (2011, September). Water, Water Use and Water Pricing Around the World. In Canadian Water Policy Backgrounders. Retrieved October 6, 2014, from http://cwf.ca/pdf-docs/publications/Water_Backgrounder_2_Sept_2011.pdf
  • Environment Canada. (2014, September 5). Lake Simcoe/South-eastern Georgian Bay Clean-Up Fund (LSGBCUF). In Environment Canada - Water - Lake Simcoe Clean-Up Fund. Retrieved September 15, 2014, from http://www.ec.gc.ca/eau-water/default.asp?lang=En&n=85C54DAE-1
0 Comments

South-Eastern Georgian Bay Watershed

10/20/2014

0 Comments

 
Part 4 of a 4-part series on watersheds

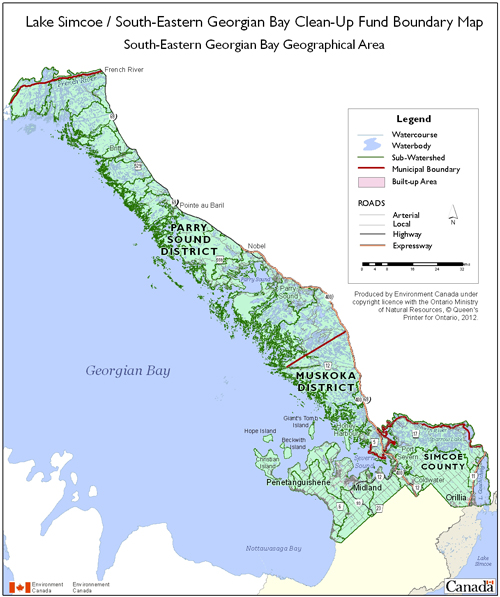
This watershed is divided into three parts, Lake Couchiching, Severn Sound, and Georgian Bay Coast. The first section is positioned at the southeastern tip of the area around the 34 square kilometre Lake Couchiching which is at the top of Lake Simcoe (EC). Severn Sound is comprised of a 130 square kilometre series of bays on south-eastern Georgian Bay (EC). The final part of this watershed is the section of coastline between Port Severn and where the French River enters Georgian Bay.

The townships of Severn, Tay, and Tiny, the Towns of Midland and Penetanguishene, and the City of Orillia in Simcoe County and areas along the coast in the Districts of Muskoka and Parry Sound are all represented in this watershed.

This watershed supports a large recreational and tourist industry. Severn Sound has a permanent population of 110,000 that swells seasonally to 300,000 (EC). The cottage industry is causing development along the coasts as it grows and this could become a concern as the integrity of the coastline is changed. Agriculture also has a presence; in Severn Sound there are about 900 farms on approximately 270 square kilometres (SSEA [1]).

Severn Sound was identified as an ‘Area of Concern’ by Environment Canada due to degraded water quality and environment health. Through phosphorus control, habitat restoration and enhancement, pollution prevention, planning, environment monitoring, and public education, it was removed from the list in 2003 (SSEA [2]).
Picture
South-Eastern Georgian Bay Watershed [Picture Source: EC]
References
  • Environment Canada. (2014, September 5). Lake Simcoe/South-eastern Georgian Bay Clean-Up Fund (LSGBCUF). In Environment Canada - Water - Lake Simcoe Clean-Up Fund. Retrieved September 15, 2014, from http://www.ec.gc.ca/eau-water/default.asp?lang=En&n=85C54DAE-1
  • Severn Sound Environmental Association. [1] (n.d.). Description of Severn Sound. In Severn Sound. Retrieved September 15, 2014, from http://www.severnsound.ca/SSEA_AU_SevSound.htm
  • Severn Sound Environmental Association. [2] (n.d.). Severn Sound Remedial Action Plan. In Severn Sound. Retrieved September 15, 2014, from http://www.severnsound.ca/SSEA_AU_SSRAP.htm
0 Comments

Nottawasaga Valley Watershed

10/14/2014

0 Comments

 
Part 3 of a 4-part series on watersheds

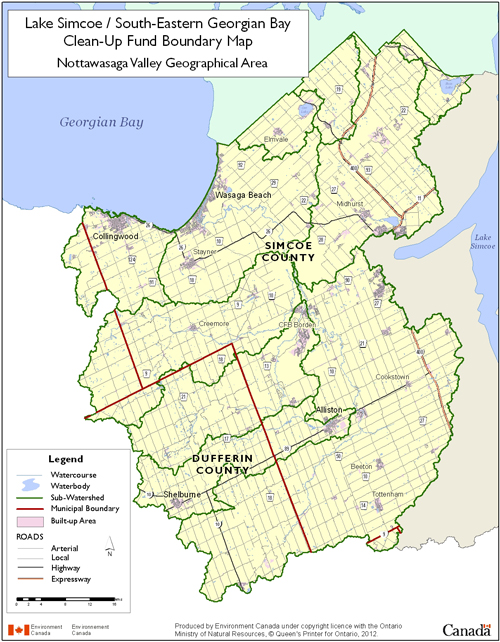
The Nottawasaga Valley Watershed is approximately 3,600 square kilometres of land and water (EC). The surface water can be broken down into three categories; there are 13 square kilometres of lakes, 585 square kilometres of stream systems, and 242 square kilometres of wetlands (EC). Georgian Bay forms part of the northern border and is also the final destination for the water which flows in at Collingwood, Wasaga Beach, and Severn Sound (NVCA). The area has been divided into 10 subwatersheds based on the different river, creek, and sound systems that drain the watershed.

The Townships of Adjala-Tosorontio, Clearview, Essa, Oro-Medonte, and Springwater, and the Towns of Bradford West Gwillimbury, Collingwood, Innisfil, New Tecumseth, and Wasaga Beach in Simcoe County, as well as the City of Barrie, the Towns of Mono and Shelburne, and Townships of Amaranth, Melancthon, and Mulmur in Dufferin County, and the Town of the Blue Mountains and Grey Highlands Municipality in Grey County and Town of Caledon in Peel Region are all represented either fully or partly in this watershed.

There are 26 square kilometres of coastal areas spaced along the 35 kilometres of Georgian Bay’s coastline (EC, NVCA). These areas are important to the tourism industry that is centred in Collingwood and Wasaga Beach. Agriculture covers a large portion of the land, but there are also areas of forest and wetlands (NVCA).

Picture
Nottawasaga Valley Watershed [Picture Source: EC]
   References
  • Environment Canada. (2014, September 5). Lake Simcoe/South-eastern Georgian Bay Clean-Up Fund (LSGBCUF). In Environment Canada - Water - Lake Simcoe Clean-Up Fund. Retrieved September 15, 2014, from http://www.ec.gc.ca/eau-water/default.asp?lang=En&n=85C54DAE-1

  • Nottawasaga Valley Conservation Authority. (2013). 2013 Nottawasaga Valley Watershed Health Check. In Watershed Report Cards. Retrieved September 29, 2014, from http://www.nvca.on.ca/Shared%20Documents/2013%20NVCA%20WHC.pdf


0 Comments

Lake Simcoe Watershed

10/6/2014

1 Comment

 
Part 2 of a 4-part series on watersheds

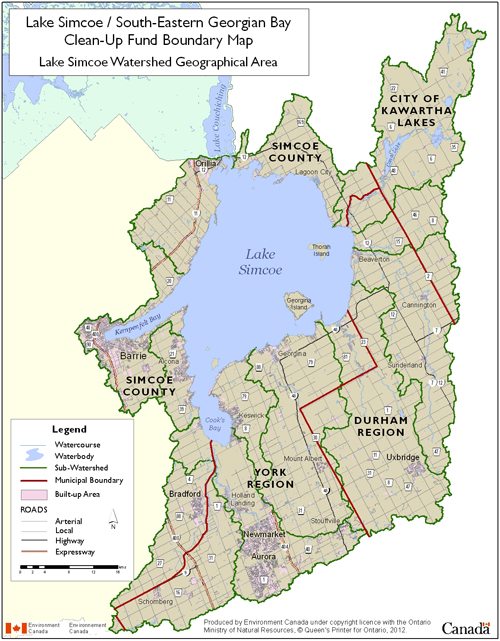
The Lake Simcoe Watershed covers 3,576 square kilometres of land and water including the 722 square kilometres of Lake Simcoe which is part of the Trent-Severn Waterway (EC, LSRCA). There are 4,225 kilometres of rivers, creeks, streams, and tributaries divided into 18 separate subwatersheds (LSCRA). There are 35 rivers in total that empty into the lake and wetlands cover 13% of the watershed (EC, LSRCA)

There are several regions and municipalities within this watershed. The Towns of Aurora, East Gwillimbury, Georgina, Newmarket, and Whitechurch-Stouffville and Township of King in York Region, the Towns of Bradford West Gwillimbury, Innisfil, New Tecumseth, Townships of Oro-Medonte and Ramara in Simcoe County, as well as the Cities of Barrie and Orillia, the Townships of Brock, Scugog, and Uxbridge in Durham Region, the City of Kawartha Lakes, and the Town of Caledon in Peel Region are all included in the watershed to some degree. Certain municipalities lie fully within the borders and others are only partly represented.

The area hosts a permanent population of above 400,000 (LSRCA). The landscape is changing as the population grows and the towns are developing to service their needs. Its location close to Toronto has caused the towns in the southern areas to become bedroom communities for the city. Presently, 8% of the watershed is urban land and 36% is agricultural land (LSRCA). All aspects of Ontario agriculture are represented within this watershed. The Holland Marsh, located in the southwest, is known as the salad bowl of Ontario. It was designated a Specialty Crop Area in 2005 and is protected from urban expansion and non-agricultural uses. Recreational activities, predominately fishing, and tourism centred around the lake contribute $200 million to the local economy each year (EC). This watershed has an evolving landscape and must contend with increasing development.
Picture
Lake Simcoe Watershed [Picture Source: EC]
References
  • Environment Canada. (2014, September 5). Lake Simcoe/South-eastern Georgian Bay Clean-Up Fund (LSGBCUF). In Environment Canada - Water - Lake Simcoe Clean-Up Fund. Retrieved September 15, 2014, from http://www.ec.gc.ca/eau-water/default.asp?lang=En&n=85C54DAE-1

  • Lake Simcoe Regional Conservation Authority. (n.d.). Our Watershed. In The Lake Simcoe Watershed. Retrieved September 22, 2014, from http://www.lsrca.on.ca/about/watershed.php

  • Planscape. (2009). Holland Marsh Agricultural Impact Study (p. 10). Ontario, Canada: Friends of the Greenbelt Foundation & Holland Marsh Growers’ Association.


1 Comment
<<Previous

    Project Updates

    Find articles on project-related topics here

    Archives

    December 2016
    October 2016
    September 2016
    July 2016
    June 2016
    May 2016
    April 2016
    March 2016
    February 2016
    January 2016
    December 2015
    November 2015
    October 2015
    September 2015
    August 2015
    July 2015
    June 2015
    May 2015
    April 2015
    March 2015
    February 2015
    January 2015
    December 2014
    November 2014
    October 2014
    September 2014

    Topics

    All
    Aerators
    Coagulation & Flocculation
    Deionization
    Discharge Characterization
    Drum Filter
    Filter Bags
    General Information
    Hydrocyclone
    Lake Simcoe
    Lesson Learned
    Muck
    Nottawasaga Valley
    Pre Treatment
    Pre-Treatment
    Sampling
    Settling Ponds/Tanks
    South-Eastern Georgian Bay
    System Evaluation
    Treatment Technologies
    Ultrafiltration
    Washing Process
    Water Quality Parameters
    Watershed

    RSS Feed

    Article Titles

    Introduction to
      Watersheds

    Lake Simcoe Watershed
    Nottawasaga Valley
      Watershed
    South-Eastern Georgian
      Bay Watershed
    Water, Water,
      Everywhere?
    The Trouble with Muck:
      Size
    Lesson Learned: Bottom-
      up Aerator to Treat
      Washwater in Settling
      Tanks
    Phosphorus, the
      Environment, and
      Farming
    Nitrogen’s Impact on Air,
      Land, and Water
    Water-borne Pathogens
      and Food Safety
    Defining Dissolved
      Oxygen
    Filter Bags
      Demonstration Site
    Organic Matter
      Breakdown &
      Biochemical Oxygen
      Demand
    Dealing with Cloudy
      Water
    Hydrocyclone
      Demonstration Test
    What IS Muck?
    Demystifying Oxidation-
      Reduction Potential
    News Release
      "Technology
      Investigation: Filter
      Bags"
    Drum Filter
      Demonstration Site
    Decomposing With(out)
      Oxygen
    Flow monitoring
    Lesson Learned: Drum
      Filter Optimization
    Polders & the Holland
      Marsh
    Vegetable Washing
      Process
    ​Dry Soil Removal
    Ultrafiltration &
      Deionization
      Demonstration Site
    News Release
      "Technology
      Investigation:
      Ultrafiltration &
      Capacitive Deionization"
    Progressive Passive
      Filtration
    ​Dissolved Air Flotation
    Clarifying the Solid
      Removal Process
    Factsheet Reading Order
    News Release:
      "Technology
      Investigation:
      Coagulation &
      Flocculation"
    Self-Indexing Filter
    Monitoring Discharge
    ​  Flows
    Settling Soil
    Mass Loading
      Calculations
    Lesson Learned:
      Technology Selection
    Electrocoagulation
    Auto-Samplers
Powered by Create your own unique website with customizable templates.