HMGA Water Project
  • Home
  • Project Overview
    • Project Description
    • Project Team
    • Collaborative Projects
    • FAQ
  • Publications
    • Blog
    • Factsheets
    • News Articles
  • Events
  • Gallery
  • Dedirting
  • Contact

Factsheet Reading Order

4/11/2016

135 Comments

 
This project has produced an array of factsheets on a range of topics. Below is the list grouped into topics and arranged in a suggested reading order. The documents can be found here, unless otherwise noted.
 
Water Qualities
#012 Water Quality Standards in Agriculture
#001 Water Quality Parameters for Vegetable Washwaters
 
Regulatory Considerations
#004 Considerations when Determining Discharge Limits
#018 Selecting a Laboratory
#006 Water Sampling & Proper Procedures
#009 Regulatory Permitting & Compliance
 
Technology Considerations
#016 Design Considerations for Vegetable Washwater Treatment Systems
#007 Choosing Washwater or Water Treatment Technologies
#002 Impact of Muck Soils on Water Treatment Systems
 
Large Solid Removal
#014 Large Solid Removal for Effective Treatment
Technology Investigation: Filter Bags (available here)
#005 Settling Ponds & Tanks
#008 Drum Filters
#010 Hydrocyclones & Centrifuges
 
Small Solid and Nutrient Removal
#003 Coagulation & Flocculation
#013 Biofiltration
Technology Investigation: Ultrafiltration & Capacitive Deionization (available here)

Polishing and Dosing
#011 Bottom Aeration
#017 Surface Aeration
#015 Water Treatment Technology Options for Washing Vegetables
135 Comments

Demystifying Oxidation-Reduction Potential

5/4/2015

1 Comment

 
When taking samples, there are several field measurements that are noted; one of them is the Oxidation-Reduction Potential (ORP) of the water. This measures the capacity of the water to release or accept electrons from chemical reactions (Bier, 2009). When the system is accepting electrons it is oxidizing and when it is releasing electrons it is a reducing system (Bier, 2009). Examples of oxidation include rusting metal or a browning apple. The ORP of a system can be affected by numerous factors including the solids, new species, or concentration changes.

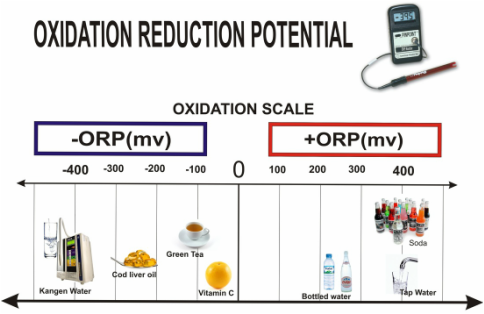
ORP is measured in millivolts (mV) using a sensor with two electrodes. The ORP electrode either accepts or donates electrons into the water, depending on the system. The reference electrode has a stable output of electrons as a comparison. The ORP is calculated using these two values. A positive value indicates the presence of oxidizing agents whereas a negative value points to contamination (Lowry & Dickman, 2013).
Picture
Examples of liquids and their ORP value [Source: https://healthykangenwater.files.wordpress.com/2010/10/orp-blog1.jpg]
The ORP of a washwater system is important as an oxidizing chemical can take electrons from a cell membrane which causes it to become leaky and damages it to the point where the cell dies (Suslow, 2004). Sensors can be deployed along washing systems for automated sensing of ORP and dispensing of oxidizing disinfectants (Suslow, 2004).

ORP is not presently a parameter of interest for discharge water. It plays a role during washing of vegetables as research has shown that the higher the ORP, the lower the survival time of certain decay, spoilage, and pathogenic bacteria (Suslow, 2004).

References
  • Bier, A. W. (2009). Introduction to oxidation reduction potential measurement. In Hach Company. Retrieved March 2, 2015, from www.hach.com/asset-get.download.jsa?id=7639984590
  • Lowry, R. W., & Dickman, D. (2013). The ABC's of ORP: Clearing up some of the mystery of oxidation-reduction potential. InService Industry News. Retrieved March 4, 2015, from http://www.rhtubs.com/ORP.htm
  • Suslow, T. V. (2004). Oxidation-reduction potential (ORP) for water disinfection monitoring, control, and documentation. InUniversity of California Division of Agriculture and Natural Resources. Retrieved March 2, 2015, from http://anrcatalog.ucdavis.edu/pdf/8149.pdf
1 Comment

Dealing with Cloudy Water

3/23/2015

0 Comments

 
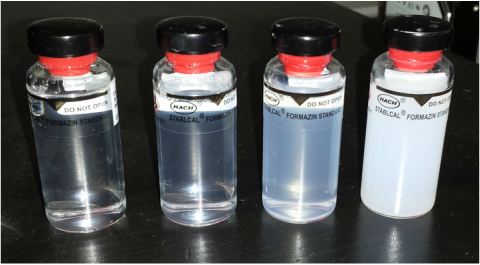
Turbidity is a measure of the lack of clarity in water from suspended or dissolved organic and inorganic particles. Turbidity is measured in nephelometric turbidity units (NTU); at 5 NTU water becomes cloudy and at 25 NTU water is murky (Figure 1). Total Suspended Solids (TSS) are particles that will not pass through a 1-1.2 micron filter. Smaller particles that pass through a 1-1.2 micron filter are known as Total Dissolved Solids (TDS).
Picture
Figure 1: Examples of solutions with varying turbidity, from left to right: 10 NTU, 20 NTU, 100 NTU, and 800 NTU
Turbidity and TSS are linked; high TSS will raise the turbidity, with the amount being site-specific since turbidity is affected by concentration, size, shape, and the refractive index of the suspended particles. High levels of turbidity and TSS have negative impacts on the health of aquatic ecosystems. High turbidity and TSS can clog fish gill mechanisms, reduce fish growth, or induce changes in fish community structures. The impact of turbidity and TSS also negatively affects invertebrate health and plant activity. TSS has potential consequences on human health as well.  Microorganisms can attach themselves to suspended particles in the water, which can prevent the water from proper disinfection resulting in human health problems. TDS in water does not directly affect human health though high levels could indicate the presence of toxic materials, in Canada the recommendation for drinking water is 500 mg/L TDS mainly for taste and aesthetics.
Picture
Figure 2: TDS levels in ppm (which is equivalent to mg/L), US level of 500 mg/L is the same as Canada [Source: http://www.tdsmeter.com/what-is]
In sensitive aquatic systems, the MOECC recommends at least 80% removal of TSS from stormwater from the original TSS level to protect the aquatic life. The Canadian Water Quality Guidelines for the protection of Aquatic Life states that turbidity should not increase by more than 8 NTU in short term exposure, or 2 NTU, for longer than 30 day exposure, over the background concentration. By adhering to guidelines this should help to protect aquatic systems from high turbidity, TSS and TDS levels.

References
  • ALS Environmental. 2014. Personal Communication on filter size for TSS measurements.
  • Canadian Council of Ministers of the Environment. 2002. Canadian water quality guidelines for the protection of aquatic life: Total particulate matter. In: Canadian environmental quality guidelines, 1999. Canadian Council of Ministers of the Environment. Winnipeg, MB.
  • Health Canada. 1991. Total Dissolved Solids. Health Canada. http://www.hc-sc.gc.ca/ewh-semt/pubs/water-eau/tds-mdt/index-eng.php
  • Manitoba Water Stewardship and Manitoba Health. 2011. Factsheet: Turbidity in Manitoba Water Supply. Province of Manitoba. Winnipeg, MB. 
  • MOECC. 2003. Understanding Stormwater Management: An Introduction to Stormwater Management Planning and Design. Ontario Ministry of Environment and Climate Change. Toronto, ON.
0 Comments

Organic Matter Breakdown & Biochemical Oxygen Demand

2/23/2015

0 Comments

 
The breakdown of organic matter (OM) in water consumes oxygen through processes that are facilitated by aerobic (needing oxygen) organisms. The amount of oxygen required to break down the organic material in a volume of water at a certain time and temperature is referred to as the biochemical oxygen demand (BOD). The standard oxidation test for calculating BOD measures the oxygen consumed in a water sample after five days, this is known as the five-day biochemical oxygen demand (BOD5). BOD accounts for the oxygen consumption of all biochemical process, including nitrification as well as breakdown of carbon based molecules. When the oxygen demand is required only for the breakdown of organic carbon molecules to carbon dioxide, it is referred to as the carbonaceous biochemical oxygen demand (CBOD). Similar to BOD, CBOD standard tests are five days since this is when most of the organic carbon oxidation occurs and is known as the five-day carbonaceous oxygen demand (CBOD5).

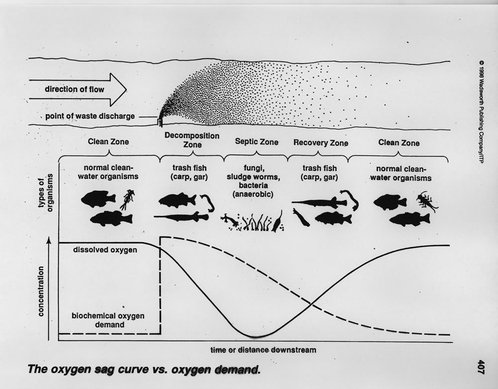
When water contains excess OM content the BOD/CBOD will be high, resulting in low dissolved oxygen (DO) concentrations; this has negative repercussions on aquatic systems. The reduction of DO is one of the main concerns when loading excess OM into a system. In aquatic systems with low DO concentrations the OM may be decomposed by anaerobic (do not require oxygen) organisms. The anaerobic decomposition of organic material produces hydrogen sulfide gas, which can be toxic to wildlife and humans. High OM loads can also cause difficulties with irrigation and plumbing due to biofilm formation and clogging, and they can reduce the efficiency of disinfection systems, which can impact food safety. 
Picture
Figure 1 BOD effects on DO and fish populations [Source: http://gvsu.edu/cms3/assets/6BDDB6FE-EF92-1DFF-13B97ABEB2F2651C/lowgrand_wit/oxygen_depletion.jpg]
Major sources of organic waste to water are pulp and paper, municipal sewage, and agriculture.  Vegetable washwater containing high OM, whether from the vegetables themselves or the soil they were grown in, also tend to have high BOD/CBOD levels. Treatment options are available and necessary for the discharge, and reuse of washwater.

For more information on Dissolved Oxygen, see 'Defining Dissolved Oxygen'.

References
  • Dorcey, A. & Freedman, B. 2013. Water Pollution. Historica Canada. http://www.thecanadianencyclopedia.ca/en/article/water-pollution/
  • CCOHS. 2010. CHEMINFO: Hydrogen Sulfide. Canadian Centre for Occupational Health and Safety. http://www.ccohs.ca/products/databases/samples/CHEMINFO.html#TOC2
  • Delzer, G.C. & McKenzie S.W. 2003.7.0 Five Day Biochemical Oxygen Demand. USGS TWRI Book 9–A7 (Third Edition). United States Geological Survey. Reston, VA, USA. http://water.usgs.gov/owq/FieldManual/Chapter7-Archive/chapter7.2/7.2.html
0 Comments

Defining Dissolved Oxygen

1/5/2015

2 Comments

 
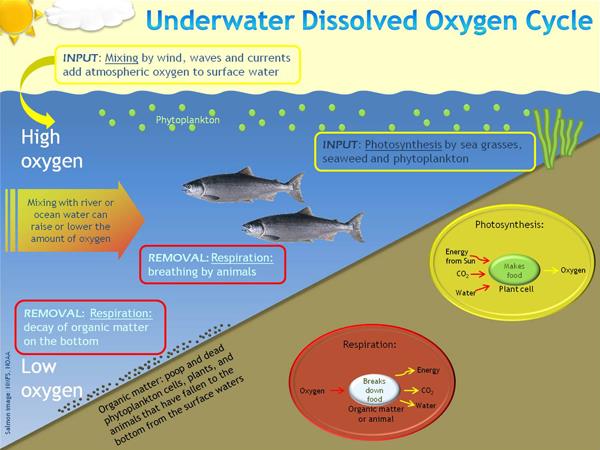
Dissolved oxygen (DO) is the amount of oxygen in water. The main sources of DO in water are the atmosphere and aquatic vegetation. The oxygen is then lost through oxidation of sediment, by respiration of aquatic organisms, and oxidation of organic matter. The input and consumption of DO in an aquatic system are influenced by temperature, water depth and water movement. 
Picture
Figure 1: Dissolved Oxygen cycle in freshwater [Source: http://www.nanoos.org/education/learning_tools/hypoxia/oxygen_underwater.php]
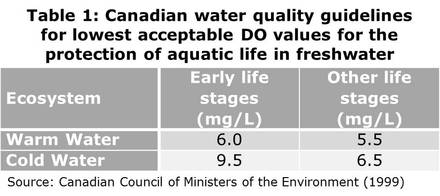
If the amount of oxygen consumed exceeds the input amount, the oxygen becomes depleted in the system. If DO levels become too low then stress is put on aquatic systems, and most aquatic species cannot survive without oxygen. The water quality guidelines for the protection of aquatic life are found in Table 1, and are dependent on water temperature and life stage. Adult fish have the ability to survive at lower values of DO depending on the species and water temperature, but the limited oxygen will negate their abilities to reproduce along with the survival of juvenile fish. If an aquatic system begins to have lower DO levels than in the past, this could change the biodiversity of the ecosystem as this will attract species which have tolerances to lower DO, or anaerobic organisms (which don’t need oxygen for survival) while ones with less tolerance will leave. 
Picture
Waste water from washing fruits and vegetables tends to have low DO levels. It is important to try and increase the DO in this water through different systems such as settling ponds with aerators and other technologies to reduce the environmental impacts. The Lake Simcoe Protection Plan indicated a goal of 7 mg/L DO in deep water in 2008; in 2012 the DO levels had improved over the values from 2008 but were not yet at the goal.

References
  • Canadian Council of Ministers of the Environment. 1999. Canadian water quality guidelines for the protection of aquatic life: Dissolved oxygen (freshwater). In: Canadian environmental quality guidelines, 1999, Canadian Council of Ministers of the Environment, Winnipeg.
  • Government of Ontario. 2013. Minister’s Annual Report on Lake Simcoe 2011-2012. Queen’s Printer of Ontario. Toronto, Ontario
  • Oram, B. 2014. Dissolved Oxygen in Water. Water Research Watershed Center. http://www.water-research.net/index.php/dissovled-oxygen-in-water
2 Comments

Water-borne Pathogens and Food Safety

12/15/2014

3 Comments

 
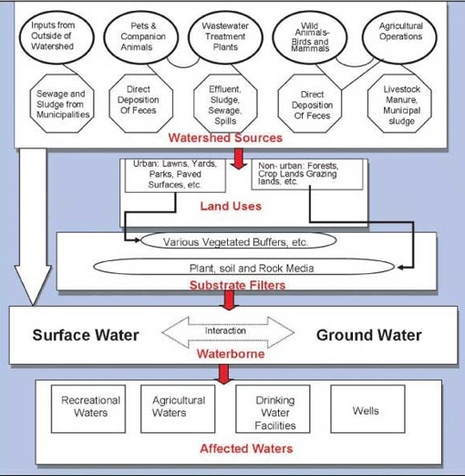
Pathogens are micro-organisms which can cause harm to human health and the environment. Pathogens include viruses, bacteria (such as E. coli and Salmonella), and protozoan parasites (such as Cryptosporidium and Giardia). Water-borne pathogens survive, and some reproduce, in water. Common sources of pathogens to aquatic ecosystems include municipal wastewater effluents, agricultural wastes (mainly livestock and poultry fecal waste), and wildlife. Surface water has a higher contamination risk than groundwater as the contaminants from the source will generally run off into the surface water before it infiltrates to groundwater.

Water-borne pathogens can be very harmful to humans, and affect health through drinking water, and fruits and vegetables that come into contact with surface water through irrigation or washing. The effect of a pathogen on humans depends on the type of pathogen and the concentration. For example, a pathogenic strand of E. coli, O157:H7, can cause illness in humans with the ingestion of fewer than 10 cells. It is estimated that 90,000 illnesses and 90 deaths a year in Canada are a result of water-borne pathogen infections. High pathogen levels in an aquatic system can also disturb human recreational activities like swimming as well as posing a threat to animal health, aquaculture and aquatic systems biodiversity.
Picture
Figure 1: Water-borne pathogen potential pathways [Source: http://www.ijc.org/php/publications/html/12br/figures/biological2.jpg]
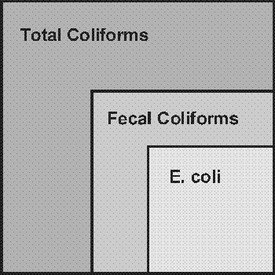
Water used for irrigation and washing is regulated to reduce the risk of pathogenic contamination of food and run off to the environment. The Canadian Guidelines for Water Quality in Agricultural Uses states that irrigation water must have less than 100 fecal coliforms/ E.coli or 1000 total coliforms in 100 ml of water; drinking water standards, which is applied to wash water, is stricter with 0 total coliforms allowed in 100 ml. Many water-borne pathogens will decrease in the environment if no additional contaminated source water is added with the length of survival depending on individual micro-organism.
Picture
Figure 2: The levels of coliforms used as indicators of contamination in water [Source: http://www.omafra.gov.on.ca/english/crops/facts/10-037.htm]
References
  • CanAgPlus. 2014. Appendices to CanadaGAP Food Safety Manuals. CanadaGAP Program. http://www.canadagap.ca/uploads/file/English/Manuals/Version%206.2%20Updates/Appendices/CanadaGAP%20Appendices%206.2%202014%20ENG.pdf
  • Edge, T., Byrne, J.M., Johnson, R., Robertson, W., & R. Stevenson. 2008. Waterborne Pathogens. In: Threats to Sources of Drinking Water and Aquatic Ecosystem Health in Canada. Environment Canada. Burlington, Ontario http://www.ec.gc.ca/inre-nwri/default.asp?lang=En&n=235D11EB-1&offset=2&toc=show#cur
  • OMAFRA. 2010. Factsheet- Improving On-Farm Food Safety Through Good Irrigation Practices. Order Number 10-037. Guelph, ON. http://www.omafra.gov.on.ca/english/crops/facts/10-037.htm
  • Public Health Agency of Canada. 2013. Food-borne and Water-borne Infections- Invisible Threats. In: The Chief Public Health Officer’s Report on the State of Public Health in Canada, 2013 Infectious Disease –The Never-ending Threat. Ottawa, ON http://www.ec.gc.ca/inre-nwri/default.asp?lang=En&n=235D11EB-1&offset=2&toc=show#cur
3 Comments

Nitrogen’s Impact on Air, Land, and Water

12/1/2014

0 Comments

 
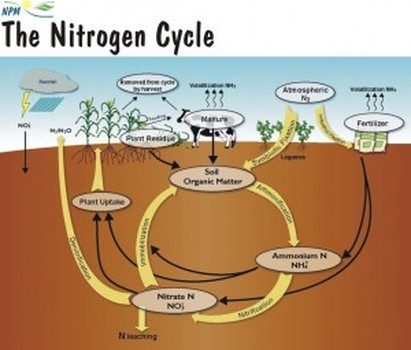
Nitrogen is an essential nutrient for the survival and growth of most living organisms.  Nitrogen gas is a large constituent of the atmosphere, making up approximately 80% of the air, but this form is inaccessible by most plants. Certain bacteria in soils have the ability to ‘fix’ naturally-occurring nitrogen from the atmosphere, which converts it to a usable form for the plants, it can also be fixed by lightning or through an industrial process which makes nitrogen fertilizers. Nitrogen is generally the limiting nutrient in terrestrial ecosystems, and is applied to fields through use of fertilizers and manure. Once in the soil, the nitrogen will be used by the crops, leached down, or emitted into the atmosphere. In the soil, ammonium (NH4+) or ammonia (NH3) is broken down by bacteria through nitrification in which it is converted first to nitrite and then to nitrate. 
Picture
Figure 1: The Nitrogen Cycle [Source: http://fyi.uwex.edu/discoveryfarms/2010/10/fall-can-be-a-good-time-for-nutrient-application-with-awareness-of-conditions/]
Both nitrites (NO2-) and nitrates (NO3-) are highly soluble forms of nitrogen and thus are transported easily in water and do not attach to the soil. Nitrite is more toxic than nitrate but since the processes changing nitrite to nitrate happen quickly it is not generally found in large quantities. Though less toxic, high concentrations of nitrate in aquatic systems can have both acute and chronic lethal effects on amphibians as well as any species which prey on amphibians, such as fish. NH3 which has not been converted through nitrification can also have harmful effects on aquatic organisms. The major sources of NH3 in aquatic systems are wastewater and treatment plants. 
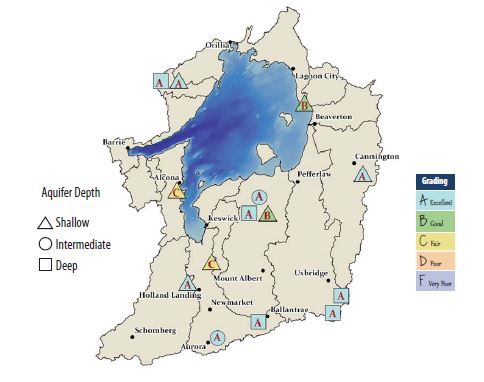
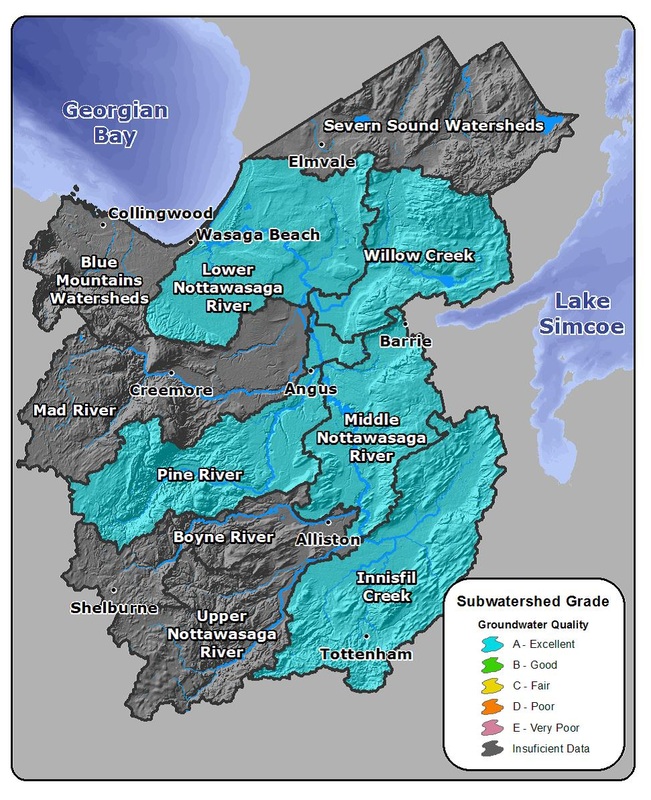
In both the Lake Simcoe Region (Figure 2) and Nottawasaga Valley (Figure 3) watersheds, the groundwater quality ranges from fair to excellent, with fair ratings due to chlorine amounts as opposed to NO2- + NO3- levels. This means that the Holland Marsh, an intensive agricultural area, contributes low amounts of NO2- + NO3-.
Picture
Figure 2: Groundwater Quality in the Lake Simcoe Watershed 2013 [Source: Lake Simcoe Region Conservation Authority, 2013]
Picture
Figure 3: Groundwater Quality in the Nottawasaga Valley Watershed 2013 [Source: Nottawasaga Valley Conservation Authority, 2013]
References
  • Lake Simcoe Region Conservation Authority. 2013. Lake Simcoe Watershed Report Card 2013. Newmarket, ON http://www.lsrca.on.ca/about/watershed_report_card.php
  • Nottawasaga Valley Conservation Authority. 2013. Nottawasaga Valley Watershed Report Card 2013. Utopia, ON http://www.nvca.on.ca/watershed-science/watershed-report-cards
  • Ontario Ministry of Agriculture and Rural Affairs. 2005. Factsheet - Environmental Impacts of Nitrogen Use in Agriculture. Order No. 05-073. Guelph, ON http://www.omafra.gov.on.ca/english/engineer/facts/05-073.htm#5
  • Rouse, J.D., Bishop, C.A., & J. Struger. 1999. Nitrogen Pollution: An Assessment of Its Threat to Amphibian Survival. Environ Health Perspect 107:799-803
  • Environment Canada. 2013. Ammonia Dissolved in Water. CAS (Chemical Abstract Service) registry number: 7664-41-7 https://www.ec.gc.ca/toxiques-toxics/Default.asp?lang=En&n=98E80CC6-0&xml=E9537B48-E09B-4FCF-8A56-F1F44B97FAE4
0 Comments

Phosphorus, Farming, and the Environment

11/24/2014

2 Comments

 
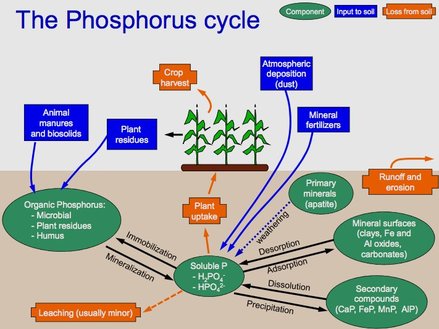
Phosphorus is an essential nutrient for plants as no other nutrient can replace it in its roles in plant growth. It plays a key role in several plant processes but its primary purpose is to store and transfer the energy produced by photosynthesis. When phosphorus is deficient the plants will be stunted and can have a darker green colour than normal. Since it is also involved in the transformation of starches and sugars, under deficient conditions sugars can accumulate and create reddish-purple blotches.
Picture
Figure 1: The terrestrial phosphorus cycle [Source: http://upload.wikimedia.org/wikipedia/en/9/91/Phosphorus_Cycle_copy.jpg]
Phosphorus has a permanent place on fertilizer recommendations as it is regularly found to be deficient. The most common source is mined rock phosphate which is processed to produce the fertilizer that is spread on fields. It comes either as solely phosphorus (Superphosphate) or combined with Nitrogen (MAP or DAP). After application the phosphorus has several fates, as shown in Figure 1; it can leach down, be taken up by plants and then off the field with the crop, or it can be removed through run-off or erosion.

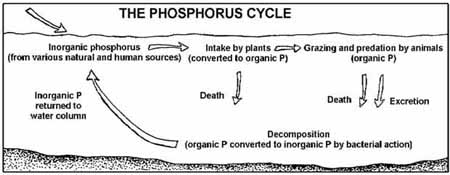
While a useful nutrient for growing terrestrial plants, phosphorus is also the limiting nutrient in aquatic ecosystems. An increased concentration supports a larger population of algae which can cause problems for other organisms. When the algae die off, the oxygen that is used during the decomposition is no longer available for plants, fish, or animals.
Picture
Figure 2: The aquatic phosphorus cycle [Source: http://upload.wikimedia.org/wikipedia/en/e/eb/Phoscycle-EPA.jpg]
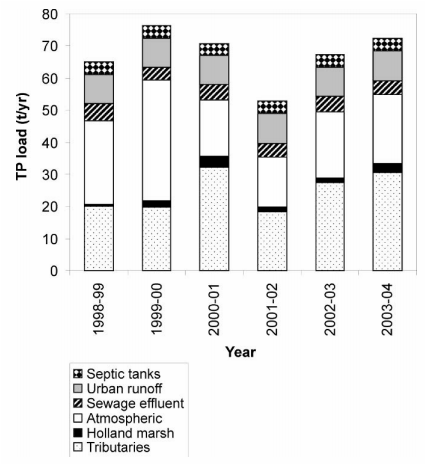
A study completed by Winter et al. (2007) evaluated the major sources of phosphorus to Lake Simcoe from 1998 to 2004 which included septic tanks, urban runoff, sewage effluent, atmospheric, the Holland Marsh, and tributaries. Of these sources the Holland Marsh, an intensive area of agriculture, contributed the least amount, between 1 and 5%, over the studied years in comparison to the other sources (Figure 3). 
Picture
Figure 3: The major sources of total phosphorus to Lake Simcoe for hydrologic years 1998/99-2003/04 (Winter et al., 2007)
References
  • MSU Extension Service. (2014, August 21). Why is my young corn stunted and purple?. In Corn in Mississippi. Retrieved from http://msucares.com/crops/corn/corn_stunted.html
  • Plant and Soil Sciences eLibrary. (2014). Importance of Phosphorus to Plants. In Soils - Part 6: Phosphorus and Potassium in the Soil. Retrieved from http://passel.unl.edu/pages/informationmodule.php?idinformationmodule=1130447043&topicorder=2&maxto=15&minto=1
  • Rehm, G., Schmitt, M., Lamb, J., Randall, G., & Busman, L. (2002). Understanding phosphorus fertilizers. In University of Minnesota Extension. Retrieved October 9, 2014, from http://www.extension.umn.edu/agriculture/nutrient-management/phosphorus/understanding-phosphorus-fertilizers/
  • Winter, J. G., Eimers, M. C., Dillon, P. J., Scott, L. D., Scheider, W. A., & Willox, C. C. (2007). Phosphorus inputs to Lake Simcoe from 1990 to 2003: Declines in tributary loads and observations on lake water quality. Journal of Great Lakes Research, 3(2), 381-396.
2 Comments

    Project Updates

    Find articles on project-related topics here

    Archives

    December 2016
    October 2016
    September 2016
    July 2016
    June 2016
    May 2016
    April 2016
    March 2016
    February 2016
    January 2016
    December 2015
    November 2015
    October 2015
    September 2015
    August 2015
    July 2015
    June 2015
    May 2015
    April 2015
    March 2015
    February 2015
    January 2015
    December 2014
    November 2014
    October 2014
    September 2014

    Topics

    All
    Aerators
    Coagulation & Flocculation
    Deionization
    Discharge Characterization
    Drum Filter
    Filter Bags
    General Information
    Hydrocyclone
    Lake Simcoe
    Lesson Learned
    Muck
    Nottawasaga Valley
    Pre Treatment
    Pre-Treatment
    Sampling
    Settling Ponds/Tanks
    South-Eastern Georgian Bay
    System Evaluation
    Treatment Technologies
    Ultrafiltration
    Washing Process
    Water Quality Parameters
    Watershed

    RSS Feed

    Article Titles

    Introduction to
      Watersheds

    Lake Simcoe Watershed
    Nottawasaga Valley
      Watershed
    South-Eastern Georgian
      Bay Watershed
    Water, Water,
      Everywhere?
    The Trouble with Muck:
      Size
    Lesson Learned: Bottom-
      up Aerator to Treat
      Washwater in Settling
      Tanks
    Phosphorus, the
      Environment, and
      Farming
    Nitrogen’s Impact on Air,
      Land, and Water
    Water-borne Pathogens
      and Food Safety
    Defining Dissolved
      Oxygen
    Filter Bags
      Demonstration Site
    Organic Matter
      Breakdown &
      Biochemical Oxygen
      Demand
    Dealing with Cloudy
      Water
    Hydrocyclone
      Demonstration Test
    What IS Muck?
    Demystifying Oxidation-
      Reduction Potential
    News Release
      "Technology
      Investigation: Filter
      Bags"
    Drum Filter
      Demonstration Site
    Decomposing With(out)
      Oxygen
    Flow monitoring
    Lesson Learned: Drum
      Filter Optimization
    Polders & the Holland
      Marsh
    Vegetable Washing
      Process
    ​Dry Soil Removal
    Ultrafiltration &
      Deionization
      Demonstration Site
    News Release
      "Technology
      Investigation:
      Ultrafiltration &
      Capacitive Deionization"
    Progressive Passive
      Filtration
    ​Dissolved Air Flotation
    Clarifying the Solid
      Removal Process
    Factsheet Reading Order
    News Release:
      "Technology
      Investigation:
      Coagulation &
      Flocculation"
    Self-Indexing Filter
    Monitoring Discharge
    ​  Flows
    Settling Soil
    Mass Loading
      Calculations
    Lesson Learned:
      Technology Selection
    Electrocoagulation
    Auto-Samplers
Powered by Create your own unique website with customizable templates.